


The Problem with Iron Mountain (IRM)
Non-GAAP REIT Stats Obscure the Fact that the Company Doesn’t Cover Its Dividend

Iron Mountain (IRM) is a favorite among REIT investors who view it as a way to earn a generous dividend yield while still enjoying participation in the cloud-driven growth of leasing data center space. IRM bulls regularly throw around the company’s 5%+ dividend yield and a coverage ratio of around 70% as reasons the company is a “no-brainer” for investors seeking safe income and growth. However, a close look under the hood reveals the fact that the company does not come close to realistically covering its dividend making it dependent on outside capital to keep its stock price from cratering.
Why Invest in a REIT?
Real Estate Investment Trusts (REITs) offer several advantages to investors seeking income. They do not pay corporate income taxes as long as they distribute at least 90% of GAAP earnings as dividends to shareholders. They are expected to produce passive income by collecting rent and paying dividends. As asset-intensive businesses, depreciation reduces GAAP earnings, which allows the REIT to keep some of the current rent for maintenance and upkeep of the property.
In recent years, the market has seen more REITs that are promising to post rapid growth in addition to generous income. However, income investors generally look to minimize risk by favoring companies that cover their dividends. This means there is a cushion left over after subtracting the dividend from the cash flow left remaining after paying expenses necessary to support the business in its current state. For traditional companies, this measure is free cash flow, or operating cash flow less capital expenditures. The measure traditionally used for REITs is Adjusted Funds from Operation which essentially adjusts cash earnings for capital spending necessary to support the existing infrastructure.
IRM touts that it only pays out around 70% of its Adjusted Funds from Operation in dividends. However, there are two major problems with this claim:
First, Adjusted Funds from Operation assumes the company is not growing. However, IRM trades for over 14x its $1.635 billion in EBITDA. If there wasn’t growth, it would likely trade for 9-10x EBITDA which with $9.25 billion in debt, would cut the share price at least in half. So, it’s tough to have it both ways. Being a growth company costs cash. No growth saves cash, but there shouldn’t be a premium valuation multiple without growth.
Second, IRM makes multiple other adjustments to its AFFO figures that make it an even more unrealistic measure of how much cash is left over to pay dividends. We will explore each of these questionable adjustments below.
A Quick Look at IRM’s Business
IRM has two basic businesses: Records Storage and Data Centers. The storage business picks up documents (mostly paper records) and stores them in warehouses for customers. Customers may take records back or have them shredded as they get older. More new documents are not making it to paper in the first place these days. In general, this business is in decay with customers shredding about 4%-5% of stored volumes each year and another 1%-2% of volumes being taken back by customers. Thus, IRM needs to pull in about 5%-6% in new business annually from new or current customers to post flat volumes. Data Centers are buildings that house computer servers for data and enterprise software for customers to provide more security by having these assets offsite, more electronic safety, power-backup systems, and cooling infrastructure.
As far as cash flow goes, the bulk of it is generated by the Records business:

Over 100% of Adjusted EBITDA is coming from the business that is in decay. This is already a problem assuming no growth spending is necessary for IRM. The company needs to grow the records business by about 5% each year just to keep the volumes in storage flat. If that doesn’t happen, the EBITDA slowly erodes each year. Again, IRM has $9.25 billion in net debt – that is 5.7x adjusted EBITDA so it cannot allow the EBITDA to erode. And IRM is spending cash to offset that decay – but it is not counting that in the AFFO figures shown above.
The Basic Measures: FFO and AFFO versus FCF
FFO (Funds From Operations) is used by REIT investors as a proxy for earnings. AFFO (Adjusted Funds From Operations) is a proxy for free cash flow. The following table shows IRM’s calculation of its dividend coverage for the last three years:

IRM justifies its method of calculating AFFO by claiming that it is only adding back non-cash items and reducing cash flow to cover maintenance capital spending. However, we can see in the table below that the traditional calculation of free cash flow less cash spent on acquisitions is well below IRM’s AFFO metric and falls far short of covering the dividend.
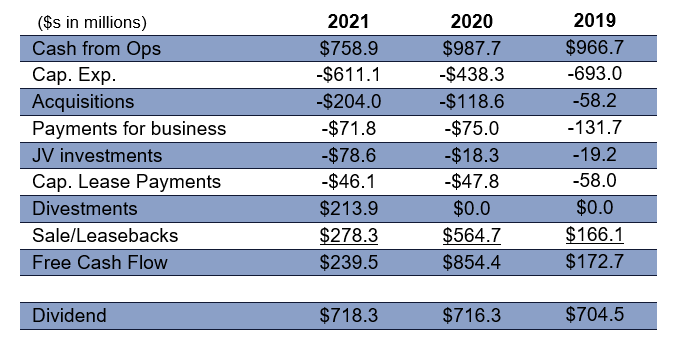
This alone should tell us that something is very wrong.
What Ongoing Costs Are Being Ignored in AFFO?
We can see above that IRM’s AFFO figure is ignoring/adding back many ongoing cash costs which inflates the figure. All of these cash outlays are necessary to maintain future cash flow and avoid the decay of the business getting smaller. We will examine each below.
Acquisitions
IRM states in its 10-K that making acquisitions is a key part of its business plan as well as its potential for growth. Until 2Q19, IRM’s earnings presentations and supplemental information releases reported the rate of decay in stored records volume as being 4%-5% in annual destruction where customers no longer need the records and has IRM shred them. In addition, another 2% of volume was taken back by customers. Covid actually helped that situation in 2020 and early 2021 as customers simply were not focusing on their archives in storage. However, we expect that inherent decay rate for volumes to return. If we look at the amount of volume in storage we see that IRM acquired the growth:

IRM is spending considerable cash annually to make acquisitions. AFFO is based largely on income and then adds back non-cash items from the Operating section of the Cash Flow Statement. However, that cash outflow for acquisitions appears in the Investing section of the Cash Flow Statement. The acquisition cost is allocated largely to Plant and Equipment which is depreciated, and to Customer Relationships which is amortized against income. However, the depreciation of PPE is a non-cash cost that is added back to Funds from Operation which is the starting point for AFFO, and the amortization of Customer Relationships is another non-cash cost added back to AFFO. In other words, none of the cash spent on acquisitions is ever reflected as a reduction to AFFO.
Acquisitions are a key part of IRM’s business model. In the last five years, IRM has paid $2.4 billion in cash for acquisitions. Without them, the business is in decay and likely wouldn’t trade at 14x EBITDA. Yet AFFO assumes that all these acquisitions have zero cost. We believe this necessary annual cash outlay should be deducted from AFFO.
Customer Acquisition Costs
There are also recurring expenses related to gaining business from existing and new customers. These also show up in the Investing section of the Cash Flow statement in multiple parts. (In the Cash Flow table above we combined them into “Payments for Business”). They consume cash every year, they are necessary for the business to be maintained, and they are completely ignored by AFFO. Here they are for the last three years:

IRM gains some business by poaching it from other storage competitors. It will write a check to buy out an existing contract and then move the documents. These are called withdrawal fees. It may also approach a client and write them a check and/or move their documents for free. These are called customer inducements. These items can also include some commissions that are capitalized and amortized. These show up as Acquired Customer Relationships and Customer Inducements. In both cases, cash is spent by IRM. It then capitalizes these costs and amortizes them into income. AFFO again ignores the initial cash outlay and then adds back the amortization as a non-cash item. Just like acquisitions – we are expected to believe acquiring business this way has no cost per AFFO.
Fulfillment costs are certainly ongoing expenses. These include the labor and transportation costs to pick up documents, bring them to the storage facility, log and organize them, as well as access them or return them to the customer when requested. These are also listed as cash outlays in the Investing section of Cash Flows. But, IRM also capitalizes these intangible assets and AFFO ignores the initial cash payment and adds back the amortization as non-cash.
There has been less activity of moving documents around since Covid began, so the cash outlays have declined in 2020 and 2021. Some of this is also explained by the jump in acquisitions noted above as IRM bought facilities with records already located there. We do believe these cash outlays will rise going forward.
Other Costs Ignored by Normalized AFFO
Two other significant and ongoing costs are left out of AFFO: stock compensation and principal payments on finance leases.
Stock Compensation
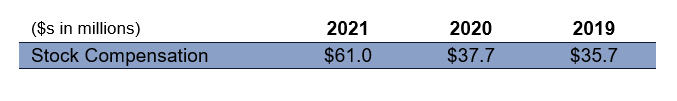
Employees consider stock options as part of their pay and are often most interested in this for their bonuses. If it is not paid to them, employees will want even higher cash wages or may leave the company. When the stock rights are exercised, it dilutes existing shareholders and raises the total amount of dividends being paid in cash. It may require IRM to repurchase shares at a higher price than what they issued the stock at to avoid this dilution.
Normalized FFO adds back stock compensation. Normalized FFO then becomes the starting point in computing AFFO. Stock compensation represents some sizeable outlays:
Principal Payments on Finance Leases
IRM uses financing leases to buy some of its equipment. As opposed to an operating lease where a $100 payment is recorded as $100 in lease expense, a financing lease is broken down as perhaps $20 in interest expense and $80 in principal repayment. The interesting part is only the $20 in interest expense and some depreciation expense impacts net income. FFO and AFFO add back the depreciation, so in this simple example – IRM pays $100 on a financing lease, but only $20 impacts FFO and AFFO. The other $80 is recorded as debt repayment in the Financing Section of the Cash Flow Statement. This is a GAAP treatment, but it ignores the full cost of the lease payment. We know they are paying it, so we believe investors should adjust results like AFFO, Cash from Operations, and even EBITDA to reflect these payments. At IRM, these are material to AFFO:

IRM’s AFFO Doesn’t Cover the Dividend After Adjustment for Just Four of These On-Going Items…
We will use IRM’s AFFO figure which adds back all amortization and depreciation and other non-cash items. Let’s then take out these recurring supposed non-cash items. And remember, IRM is supposed to be a growth company – that keeps its EBITDA multiple higher. If it doesn’t pay to offset the decay in the basic business, the multiple is very unlikely to be 14x:

From this perspective, IRM isn’t covering the dividend even with the Covid decline in fulfillment costs and other payments to acquire new business (see Payments for Business line) in 2020 and 2021.
Unfortunately, We See Several Other Cash Outlays that are Rising Too
Earlier we showed the cash flow statement for IRM. It shows that as a REIT IRM is actively selling real estate properties in Sale-Leaseback transactions. That is boosting the operating lease expense and which will reduce AFFO:

It’s tough to find 9% growth rates in the company’s storage business – but lease costs should keep growing.
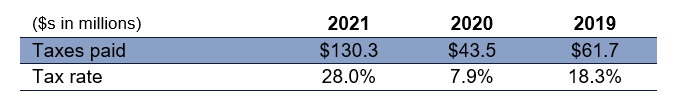
Also, IRM is a REIT and shouldn’t have much in taxes. However, a REIT structure is a US feature. As part of the operating model, IRM is expanding overseas where passive real estate companies do pay income taxes. On top of that, IRM is focusing less on owning real estate in the US and more on managing the operating company. In the US, that income is taxable and those operating units are called TRS (Taxable REIT Subsidiaries). As those areas of the business become a larger part of the full operation, we expect cash taxes to rise too. That’s already happening:
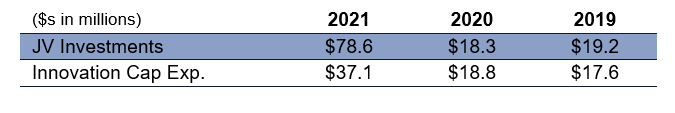
It is also sending an increasing amount of cash into its Joint Venture investments and what it calls innovation capital spending. If we ignore other growth capital spending and only penalize AFFO for the maintenance spending figure IRM uses, these two items are still growing and are cash outlays:
Finally, for a company that makes many acquisitions, it is continually restructuring and taking integration charges. Some of this involves writing down assets and is non-cash. In other cases, it is severance pay, third-party consultants, or reworking the existing buildings with newer equipment or features. As IRM wants to get more involved in Data Centers, we’d argue the maintenance spending there should be going up too. Those properties need updates in safety, power, equipment, and software more frequently, in our view. Here is what IRM has reported in these areas for the last three years:

We will let investors make up their minds as to the recurring nature of some of these expenses. We would agree that those four expenses may be lumpy and in some cases can be deferred in some years. However, we think all signs point to more spending in these areas and this company already cannot cover its dividend using a reasonable measure of ongoing net cash flow. On top of that, it has already sold off real estate which is boosting its rent expense, and that cash is gone. Debt is standing at 5.7x EBITDA and EBITDA is inflated by many of the same items we’ve talked about above. If we only adjust the $1.635 billion in EBITDA for the capital lease payments of $46.1 million and the cash payments to fulfill customer contracts of $71.8 million, Debt-to-EBITDA is 6.1x now. And IRM clearly cannot pay for new growth capital spending or acquisitions without borrowing more.
Contact behindthenumbers@btnresearch.com for questions regarding our institutional service.
Please feel free to share A Peek Behind the Numbers with interested colleagues:
Disclosure:
This article is intended for educational purposes and not investment advice.
Behind the Numbers, LLC is an independent research firm structured to provide analytical research to the financial community. Behind the Numbers, LLC is not rendering investment advice based on investment portfolios and is not registered as an investment adviser in any jurisdiction. All research is based on fundamental analysis using publicly available information including SEC filed documents, company presentations, annual reports, earnings call transcripts, as well as those of competitors, customers, and suppliers. Other information sources include mass market and industry news resources. These sources are believed to be reliable, but no representation is made that they are accurate or complete, or that errors, if discovered, will be corrected. Behind the Numbers, LLC does not use company sources beyond what they have publicly written or discussed in presentations or media interviews. Behind the Numbers does not use or subscribe to expert networks. All employees are aware of this policy and adhere to it.
The authors of this report have not audited the financial statements of the companies discussed and do not represent that they are serving as independent public accountants with respect to them. They have not audited the statements and therefore do not express an opinion on them. Other CPAs, unaffiliated with Mr. Middleswart, may or may not have audited the financial statements. The authors also have not conducted a thorough "review" of the financial statements as defined by standards established by the AICPA.
This report is not intended, and shall not constitute, and nothing contained herein shall be construed as, an offer to sell or a solicitation of an offer to buy any securities referred to in this report, or a "BUY" or "SELL" recommendation. Rather, this research is intended to identify issues that investors should be aware of for them to assess their own opinion of positive or negative potential.
Behind the Numbers, LLC, its employees, its affiliated entities, and the accounts managed by them may have a position in, and from time-to-time purchase or sell any of the securities mentioned in this report. Initial positions will not be taken by any of the aforementioned parties until after the report is distributed to clients, unless otherwise disclosed. It is possible that a position could be held by Behind the Numbers, LLC, its employees, its affiliated entities, and the accounts managed by them for stocks that are mentioned in an update, or a Peek Behind the Numbers article.