


The Hidden Tech Headwind
Rising stock compensation as a percentage of sales threatens to set in motion a vicious cycle

All eyes are on tech. The initial wave of AI hype has cooled off and the threat of more interest rate increases is deflating the present value calculations analysts use to discount the generous earnings some of these young companies promise to eventually report. The Technology Select SPDR Fund is down roughly 10% from its July peak and investors seem to be in “wait and see” mode. While we are by no means predicting another dot.com crash, we will observe that many of these companies are still selling for sky-high multiples, and more importantly, we believe many investors are not seeing the recent hidden boost to earnings growth that many tech companies have received by growing their stock compensation at a faster pace than revenues.
Note that we are not referring to just the general distortion of non-GAAP earnings from adding back stock compensation. That’s bad enough, but adding back stock compensation becomes even more of a distortion when it is rising as a percentage of sales and artificially inflating non-GAAP margins and profit growth. Think of it this way- if a company ignores expenses amounting to 20% of sales this quarter, and that same expense item rises to 22% in the next quarter due to an increase in the expense amount, adjusted margins will benefit by 2%. Exposure to this trend stalling or even reversing puts these companies at even more risk of an earnings disappointment if wavering stock prices prompt employees to demand higher cash wages which can’t be added back to non-GAAP results. (We promise you that the employees are aware of the Technology Select SPDR Fund’s recent performance too.) An earnings miss can set in motion a vicious cycle where the stock price is pushed down, driving employees to demand more cash compensation. Higher cash spending crimps cash flow (which some of these companies are already low on) and can pressure earnings and non-GAAP PE ratios which pushes the stock even lower. Finally, pressure on cash flow may stunt investing in R&D and marketing and penalize future revenue growth in the longer term.
The pre-Elon, pre-Covid history of Twitter is a great illustration of this dynamic at work. Twitter went public on Nov 7, 2013, at an IPO price of $26 and quickly rose to over $70. In 2015 and 2016, Twitter’s non-GAAP EPS was only about 30 cents, so the valuation was still 120x adjusted EPS even with the stock in the mid-$30s. By 2015, it was clear the revenue growth was slowing rapidly which took the stock price down further. As the stock reached $14 in 2016, Twitter couldn’t use its stock as currency as easily as it had in the past and stock compensation began to decline. It fell from 90% of revenue in 2013 to 11% in 2018. Notice also that Twitter began investing less in R&D and sales and marketing both in terms of cash and stock compensation:

With Twitter’s rapid revenue growth early on, it saw stock compensation decline as a percentage of sales. 100% revenue growth can drive some serious leverage on the cost side.
To find the companies most vulnerable to this phenomenon, we began looking for companies with market capitalizations greater than $5 billion and non-GAAP PE ratios of at least 40. We dug through their financials looking for the following characteristics:
Slowing or non-stratospheric revenue growth
Without adding back stock compensation, earnings would be negative and cash flow would be materially lower.
An increase in stock compensation as a percentage of sales has resulted in a material tailwind to non-GAAP EPS growth in recent quarters creating more froth that could unwind and hurt the stock price.
We highlight instances of companies that fit the above traits but have peers that are less aggressive.
We also include some more established companies that have benefited from stock compensation rising as a percentage of sales which makes them more at risk of an earnings miss.
We provide a list of 34 at-risk companies and look more closely at 8 which stand out as strong illustrations. Note that these include some of the most popular growth names in the market today from both the tech and non-tech arenas as well as some large, established tech companies you might not expect to show up on the list.
Let’s go “Behind the Numbers.”
The table below shows stock compensation as a percentage of sales for the last eight quarters and the most recent quarter’s revenue growth for the 34 companies that fit the criteria mentioned above. It also indicates if free cash flow would be negative if stock compensation was treated as a cash expense.
Note that our calculations in the table utilize stock compensation as disclosed on the cash flow statement. For a few companies, this may differ slightly from the amount disclosed in non-GAAP reconciliations due to taxes. However, the difference is not meaningful to the outcome of the results.
(click on image to enlarge table)

Note that we estimate that all of the companies above have seen positive impacts on their non-GAAP EPS from increases in stock compensation as a percentage of sales sometime in the last few quarters. Below, we will take a close look at a few of these companies where that impact has been especially meaningful.
Cloudflare Inc (NET) vs. Palo Alto Networks (PANW)

In the last two years, NET’s stock compensation as a percentage of sales jumped from 15.8% to 23.2% despite sales more than doubling.
Last quarter, stock compensation was $71.6 million while non-GAAP income was only $33.7 million and free cash flow was only $20.0 million. If employees demand more cash pay, non-GAAP income and free cash flow would drop noticeably.
A 10% drop in stock compensation would cut non-GAAP income by more than 20%.
The 190bp rise in stock compensation in 2Q23 added 1.6 cents to non-GAAP EPS, which was only 10 cents.
NET is trading for 135x 2024’s estimated non-GAAP EPS of 45 cents- we would call that priced for perfection.
NET is already seeing cash investment spending decline as a percentage of sales.

This could quickly become a headwind to earnings if the use of stock compensation declines.
Now contrast NET with its peer, Palo Alto Networks (PANW):

PANW is showing strong sales growth that is holding up and about 25%
Notice that stock compensation in dollar terms has been flat and as a percentage of sales has been declining.
Last quarter, PANW beat forecasts for non-GAAP EPS by 15 cents even with stock compensation falling 274bp as a percentage of sales which was a 15-cent headwind.
In 3Q23, PANW beat forecasts by 12 cents for non-GAAP EPS, and the 137bp drop in stock compensation as a percentage of sales was a 6-cent headwind.
Unlike NET, PANW’s Free Cash Flow exceeds the amount of stock compensation. Free cash flow was $377 million and $401 million in the last two quarters vs. $254 million and $271 million in stock pay.
PANW is getting some margin leverage on cash R&D and sales and marketing as well, but it continues to invest more in dollar terms.

Datadog (DDOG) vs. MongoDB (MDB)

DDOG has seen stock compensation continue to rise in dollar terms. But the percentage of sales has stayed relatively flat for several quarters.
The company is regularly beating non-GAAP estimates by about 7 cents. Last quarter the beat was 8 cents, and in 1Q23, it was 4 cents.
Note that stock compensation being added back is the only reason DDOG has positive non-GAAP EPS – it was 94% of EPS last quarter and 115% of EPS in 1Q23.
Free cash flow also relies heavily on stock compensation which was 83% of free cash flow in 2Q23 and 97% in 1Q23. It’s worth noting that DDOG also saw capital spending drop sequentially by $6 million last quarter and accounts receivable declined by $31 million which both boosted free cash flow.
DDOG is also seeing cash R&D flatten out as a percentage of sales and Sales and marketing is declining in dollar terms now and as a percentage of sales, which helped EPS by 2 cents in both 2Q23 and 1Q23.

Contrast that with DDOG’s peer, MongoDB (MDB):
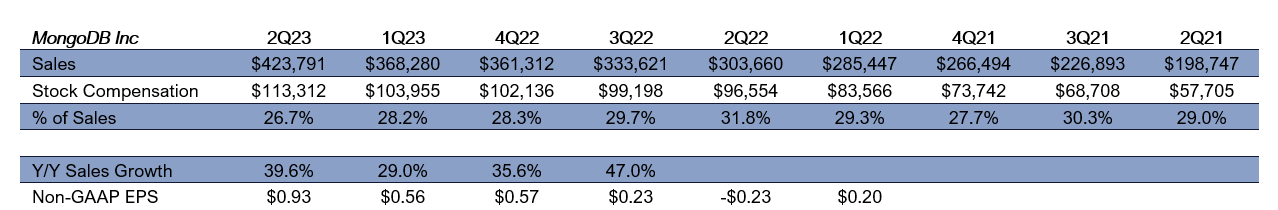
MDB’s stock compensation is declining as a percentage of sales. Last quarter, the 149bp drop was an earnings headwind of 6.1 cents and MDB still beat handily by 48 cents.
However, MDB still needs to pay employees with stock to generate positive free cash flow. Its 2Q normally sees a negative FCF figure and in other quarters it is $8-$50 million – still far below the stock compensation of about $100 million being added back.
It is worth noting that a huge driver of negative FCF last quarter was a decline in deferred revenues. MDB said that it did not require upfront payments on longer-term renewals. That would be worth watching. If that continues, it will pressure MDB’s cash flow and could more than offset some of the improvement in earnings quality coming from reducing stock compensation as a percentage of sales.
MDB also has recently helped free cash flow by spending less on capital expenditures and it finances some purchases with finance leases where the principal repayment appears in the financing section not the operating section like other leases which inflates free cash flow.
MDB is growing sales faster than DDOG of late so some expense leverage should be expected. However, you may want to note the drop in dollars and percentage in 1Q24 for sales and marketing which added 9 cents to EPS. The recovery in 2Q24 still added another 11 cents.
Marvell Technology (MRVL)
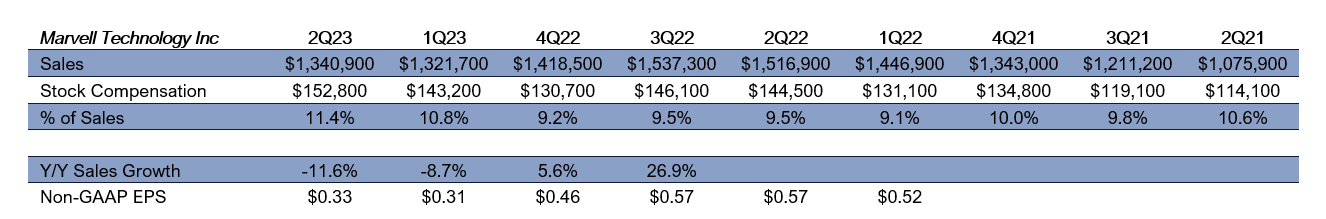
MRVL’s stock compensation is 44% of pretax non-GAAP income. Free cash flow was a negative $27.4 million and a positive $55.9 million in the last two quarters after factoring in payments for tech licenses which appear in the financing section of the cash flow statement- if stock compensation was paid in cash, both periods would show negative free cash flow.
Stock compensation is rising as a percentage of sales and dollar terms as sales growth is negative.
MRVL is not beating forecasts by wide margins. It beat forecasts by 2 cents in 1Q24, but it picked up 2.5 cents from stock compensation rising 160bp as a percentage of sales. In 2Q24, MRVL beat by 1 cent and gained 1 cent from the 60bp increase in stock compensation.
MRVL also has an issue with weaker sales at several units offsetting its AI sales. Plus, in late 2020 and 2021, chips were in short supply, and variable consideration for discounts and pricing adjustments were lower. Variable considerations net against sales. Last year, they were 19%-20% of sales – now they are 27%. We covered this in detail recently in Behind Marvell Technology’s Numbers.
Snowflake Inc. (SNOW)

Stock compensation rose to 44.5% of sales last quarter from 42.4%.
This added 3.3 cents to non-GAAP EPS last quarter where SNOW earned 22 cents.
Stock compensation was $314 million vs. $69 million in FCF and $81 million in non-GAAP income.
Lattice Semiconductor Corporation (LSCC)
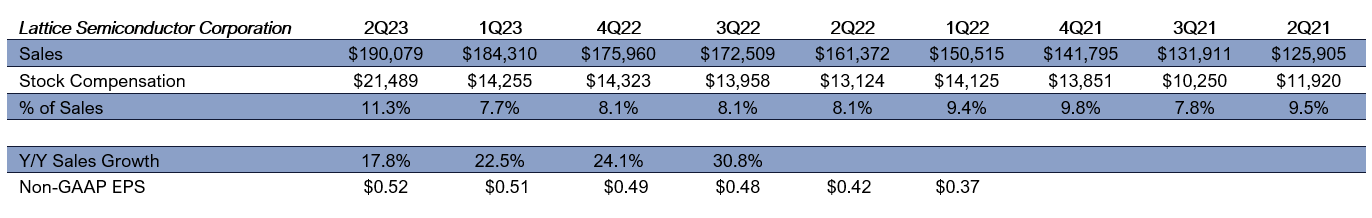
LSCC’s stock compensation rose to 11.3% of sales from 7.7% of sales last quarter.
LSCC beat forecasts by only 1 cent, but the impact of rising stock compensation as a percentage of sales added 3.8 cents to non-GAAP EPS.
However, LSCC is not as exposed to paying more cash compensation as some of the companies above, as it does post positive GAAP income and FCF of $67 million exceeds the $21 million in stock compensation.
Advanced Micro Devices Inc. (AMD)

AMD boosted stock compensation to 6.5% of sales last quarter compared to 5.8% the previous quarter. Only two years ago, sock compensation was only 2% of sales.
AMD only beat forecasts by 1 cent last quarter, but it picked up 2 cents in non-GAAP earnings from the increase in the stock compensation add-back as a percentage of sales.
AMD’s sales have been flat to down, but stock compensation is now the bulk of its free cash flow. Stock compensation was $348 million vs free cash flow of $254 million last quarter and $309 million vs free cash flow of $328 million the quarter before.
Please share our column with any interested friends and colleagues…
You can follow us on Twitter here
Disclosure:
This article is intended for educational purposes and is not investment advice.
Behind the Numbers, LLC is an independent research firm structured to provide analytical research to the financial community. Behind the Numbers, LLC is not rendering investment advice based on investment portfolios and is not registered as an investment adviser in any jurisdiction. All research is based on fundamental analysis using publicly available information including SEC filed documents, company presentations, annual reports, earnings call transcripts, as well as those of competitors, customers, and suppliers. Other information sources include mass market and industry news resources. These sources are believed to be reliable, but no representation is made that they are accurate or complete, or that errors, if discovered, will be corrected. Behind the Numbers, LLC does not use company sources beyond what they have publicly written or discussed in presentations or media interviews. Behind the Numbers does not use or subscribe to expert networks. All employees are aware of this policy and adhere to it.
The authors of this report have not audited the financial statements of the companies discussed and do not represent that they are serving as independent public accountants with respect to them. They have not audited the statements and therefore do not express an opinion on them. Other CPAs, unaffiliated with Mr. Middleswart, may or may not have audited the financial statements. The authors also have not conducted a thorough "review" of the financial statements as defined by standards established by the AICPA.
This report is not intended, and shall not constitute, and nothing contained herein shall be construed as, an offer to sell or a solicitation of an offer to buy any securities referred to in this report, or a "BUY" or "SELL" recommendation. Rather, this research is intended to identify issues that investors should be aware of for them to assess their own opinion of positive or negative potential.
Behind the Numbers, LLC, its employees, its affiliated entities, and the accounts managed by them may have a position in, and from time-to-time purchase or sell any of the securities mentioned in this report. Initial positions will not be taken by any of the aforementioned parties until after the report is distributed to clients, unless otherwise disclosed. It is possible that a position could be held by Behind the Numbers, LLC, its employees, its affiliated entities, and the accounts managed by them for stocks that are mentioned in an update, or a Peek Behind the Numbers article.