


Newell Brands and a Little Alchemy of Finance
How the black market helped a Fortune 500 company turn a collapsing economy into its largest source of reported growth


Over the last few years, we have covered with our institutional clients how several US-based companies with Latin American operations are reporting unrealistically high organic growth figures due to persistently high inflation rates in certain Latin American countries. Paid subscribers may want to review our recent piece Mondelez International- Part Two for how this phenomenon is currently impacting that company.
In short, organic sales figures typically adjust out the impact on the company’s sales growth of acquisitions and divestitures as well as positive or negative impacts from foreign currency translation. This is intended to give investors an idea of how much of the current period’s growth rate can be expected to carry over into upcoming periods. The potential distortion arises when a segment is doing business in countries that are experiencing a sizeable and ongoing deterioration of their functional currencies due to inflation. In such a situation, the company is typically raising prices much faster than would be sustainable in other markets to compensate for the inflation. Meanwhile, the deterioration in the currency relative to the dollar is resulting in a large, negative impact on reported GAAP revenue growth. However, organic sales remove the negative currency impact while keeping the beneficial impact of the price increase that itself would not be possible without the rapid inflation. While this is currently impacting several companies we are following for institutional clients, the most egregious case we have ever seen of currency exchange rates leading to massive distortion of results was the case of Newell Brands (NWL) from 2012-2015.
Newell Brands, Venezuela, and Black Market Exchange Rates
The currency distortion at NWL reached comic book levels of incongruity while the company played along for several years. Perhaps it was related to the fact that their bonuses were tied to it. From 2010-2014, 40% of management bonuses were linked to sales growth targets:
It was obvious that NWL was not a high-growth company and management was often not hitting their full bonus on sales results. This wasn’t 100% or zero – they were earning part of the sales performance payment every year. However, Venezuela’s hyperinflation played a key part in the reported sales growth.
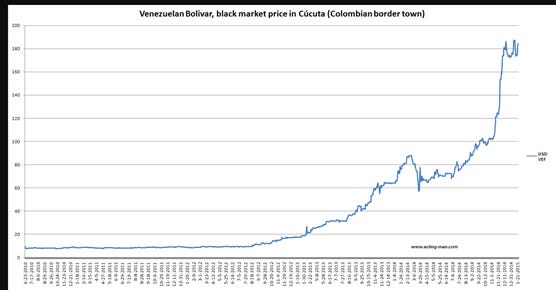
Ten years ago, Venezuela was well along in the process of falling apart which resulted in a massive deterioration in the value of its currency, the bolivar. While there was the official exchange rate set by the government, most transactions were actually conducted on the black market at more realistic rates. The following table from the acting-man.com blog shows the unofficial black market price of a US dollar in bolivars. We see how on the black market, where most people were actually doing business, the value of bolivar/dollar exchange rate skyrocketed from roughly 12 bolivars to a dollar to over 180 bolivars to a dollar in just four years:
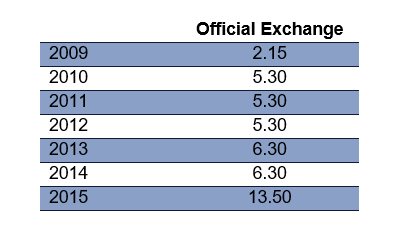
However, the government had a much more optimistic view of the situation. The official exchange rate was 2.15 bolivar to the dollar in 2010 and while it rose some, the increase was nowhere near as rapid as that of the black market rate:
Let’s keep a few things in mind. First, hyperinflation is not a sign of a great economy and prosperity. The people of Venezuela were eating their pets and telling children Santa Claus wasn’t coming. Second, the company’s definition of core sales, like many, excluded the impact of foreign exchange. It was essentially acquisition-adjusted volume growth plus the growth in prices. And remember, prices were increasing at a much higher rate than in normal markets to adjust for the inflation the country was experiencing. The combination of these metrics made Latin America appear to be NWL’s greatest market.
Fueled by Venezuela, Latin America Becomes NWL’s Biggest Source of Growth
In 2010 and 2011, NWL began to talk about Latin America as if it was their growth vehicle. For 2010, NWL reported core sales growth of 1.8% with 1.8% of positive FX. The 2010 10-K stated:
“Core sales increased 1.8% compared to the prior year, driven by growth in the Company’s international businesses, particularly in emerging markets, with double-digit core sales growth in the Latin America and Asia Pacific regions, across substantially all segments.”
In 2011, management noted that core sales grew 2.2% and foreign currency translation was a 1.6% drag, saying in the 10K:
“Core sales increased 2.2% compared to the prior year, driven by double-digit core sales growth in the Latin America region and high-single-digit core sales growth in the Asia Pacific region.”
In 2012, Newell started adding more color by breaking out core sales growth and the related foreign currency impact by geographic segment:
Again, management touted the rapid growth in Latin America core sales in the 10-K:
“Core sales increased 2.9% compared to the prior year, driven by growth in the Company’s international businesses, particularly in emerging markets, with double-digit core sales growth in the Latin America and Asia Pacific regions. The growth in emerging markets was partially offset by a decline in the Company’s European business due to a challenging macroeconomic environment.”
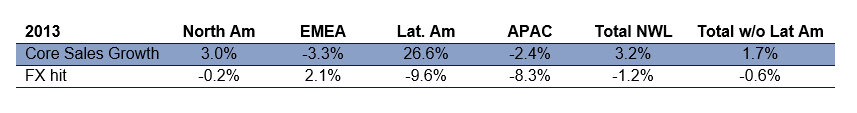
By 2013, Latin American core sales growth had jumped to more than 26%:
“Core sales in the Company’s Latin America businesses increased 26.6%, including a core sales increase in the Writing segment driven by increased volumes and price increases implemented in response to the devaluation of the Venezuelan bolivar”
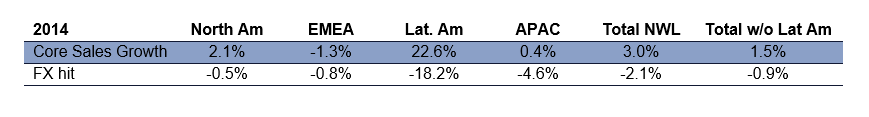
Per management on 2014 results in the 10-K:
“Core sales in the Company’s North American and international businesses grew 2.1% and 5.4%, respectively. Latin America led with 22.6% core sales growth driven by strong innovation and pricing in the Writing segment, particularly in Venezuela, and strong innovation and increased distribution in the Tools segment in Brazil.” And “Overall, core sales growth in Venezuela contributed 70 basis points to core sales growth in 2014.”
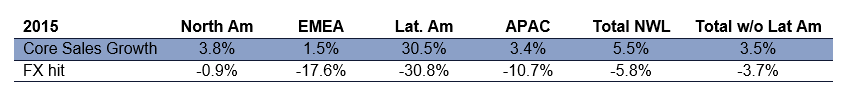
By 2015, Latin American core sales growth topped 30%. Per management on 2015 results in the 10-K:
“Core sales in the Company’s North American and international businesses increased 3.8% and 10.0%, respectively. Latin America led with core sales growth of 30.5% as a result of pricing and volume in the region, including Venezuela, improved Back-To-School performance, volume gains in the Win Bigger businesses and increased advertising and promotion.” And “Overall, core sales growth in Venezuela contributed 160 basis points to the Company’s 5.5% core sales growth in 2015.”
Newell’s overall growth was being fueled significantly by Venezuela’s hyperinflation. And the impact was getting bigger during this period. In 2015, NWL said that Venezuela was 2.0% of total sales after being 1.4% in 2014 and 2013. Just like Mondelez – much of that hyperinflationary growth was eaten up by FX losses.
The Spread Between the Black Market and Official Exchange Rate Also Fueled Profits
In 2015, Newell went even further on its disclosure. It reported that sales in Venezuela were $130.2 million and operating income was $51.1 million – a margin of 39%. That was up from 2014 when sales to Venezuela were $80.2 million and operating income was $30.0 million – a margin of 37%. That was more than triple the total company’s operating income margin of 12.4% in 2015 and 12.6% in 2014! That includes adding back restructuring charges and pension settlement charges. Venezuela was not only the fastest-growing market on Earth for Newell, it was also the most profitable! How is that possible? Here’s where the black market comes into play.
NWL’s products were selling at black market prices, but the company was converting the sales to US dollars at the official exchange rate. This type of disclosure was in all the 10-Ks from 2010-2015:
“Beginning in July 2013, the Venezuelan government authorized certain companies that operate in designated industry sectors to exchange a limited volume of bolivars for U.S. Dollars at a bid rate established via weekly auctions under a system referred to as “SICAD I.” During the first quarter of 2014, the government expanded the types of transactions that may be subject to the weekly SICAD I auction rate while retaining the official rate of 6.3 bolivars per U.S. Dollar and introduced another currency exchange mechanism (“SICAD II”). The official exchange rate for settling certain transactions through the National Center of Foreign Trade (“CENCOEX”), including imports of essential goods, remains at 6.3 bolivars per U.S. Dollar. As of December 31, 2014, the SICAD I auction rate was 12.0 bolivars per U.S. Dollar, and the SICAD II rate was 50.0 bolivars per U.S. Dollar. The Company continues to believe that transactions for imports of essential goods, such as certain raw materials and finished goods (primarily in the Writing segment), may be settled at the official exchange rate of 6.3 bolivars per U.S. Dollar, and the Company has continued to receive authorizations to import product and to receive cash for vendor payments at this rate.”
What does this mean? Let’s say NWL produced pens at $1.00 each and sold them for $1.50. If it sold ten pens in North America the math is easy. Revenue is $15 and cost is $10. But now go to Venezuela in 2014. On the black market, a dollar was worth 80 bolivar. Thus, NWL was getting 120 bolivars per pen. Ten pens are 1,200 bolivars in revenue and we know they cost $1 each or $10 in total. But, NWL didn’t convert the 1,200 bolivars at 80 to 1. It was converting at 6.3 to 1, the official exchange rate. At the 80 to 1 black market rate, revenue would be $15. But at the 6.3 to 1 exchange rate, revenue was $190.50. Suddenly profit is $180.50, not $5.00.
To really have some fun, imagine if they were selling pens for 20 cents in Venezuela that cost $1.00 to make. That should be a money-losing deal, right? Not when there is a black market. At 80 to one 1 on the black market, NWL could get 16 bolivars per pen, or 160 for ten. If converted at the official 6.3 to 1 rate, it reports $25.40 in revenues against $10 in costs – a money-losing transaction is suddenly profitable!
Management was also awarded performance bonuses for hitting adjusted EPS and margin targets. Venezuelan FX losses were specifically added back to those adjusted figures and converting results at an absurd official rate helped NWL reach those targets.
Read the 10-Ks - There Were Visible Signs That Things Weren’t as Great as They Looked
Newell reported that Venezuela was $65 million in sales and $25 million in operating income in 2009. However, due to the first change in the official exchange rate, it wrote off $30 million in assets including cash due to FX losses.
The carrying value of the Venezuelan assets kept rising - $29.5 million in 2010, $43.2 million in 2011, $63.4 million in 2012… At the same time, NWL guided to a charge coming in 2013 from devaluation and expected sales and income to be hit by $5 million and $3 million, respectively.
In 2013, Newell took an $11 million charge and asset values still rose to $87.3 million.
In 2014, Newell added this disclosure:
“In addition, in the first quarter of 2014, the Venezuelan government issued a Law on Fair Pricing which establishes a maximum profit margin of 30%, thereby limiting the Company’s ability to implement price increases, which had been one of the key mechanisms to offset the effects of continuing high inflation and the impact of currency devaluation. In 2015, regulations will require the Company to identify the ultimate retail price to consumers on products it sells, which could adversely affect the prices the Company charges to its distributor customers.”
Also in 2014, NWL reported that cost of goods had a $5.2 million hit from Venezuelan currency. Overall, its Venezuelan sales declined $42 million and operating income by $24 million due to the devaluation of that currency. It then took a $45.6 million hit to asset values, which reduced them to only $55.8 million.
In 2015, NWL’s 10-K said the government limited profit margins to 20% and also stopped allowing currency exchange at the official rate. That brings to mind the old investment question – what is a stock worth that rises 20% annually forever but you can never sell it? The answer is zero. NWL concluded that too.
In 2015, Newell deconsolidated its Venezuela’s operations as it was noting that sales there rose from $80 million in 2014 to $130 million in 2015. It took another $9.2 million loss on FX there and announced it was writing its assets in Venezuela to zero based on the inability to get its cash converted to dollars and recognizing that the actual exchange rate was 170 to the dollar. Its assets still increased again in 2015 to $74.7 million before being written to zero, and it wrote off another $58.3 million in Venezuelan assets held by other NWL subsidiaries. The total charge was $172.7 million.
Altogether, NWL reported about $270 million in write-offs related to Venezuela between 2009-2015. We do not know every year’s specific operating income for that unit, but know that 2009 was $25 million, 2013 was $34 million, 2014 was $30 million, and 2015 was $51 million. It seems likely that operating income attributed to Venezuela was about $200-$220 million in total during that timeframe. Comparing that to the $270 million in write-offs means that NWL lost more money on its Venezuelan operations than it earned – but this was one of the biggest drivers of its non-GAAP reported growth and profitability.
Epilogue
While we addressed NWL’s experience with Venezuela’s hyperinflation here, that is hardly the only accounting quality problem at NWL we pointed out to institutional clients over the years. The company continually took restructuring charges for decades. It has grown via acquisition many times and moved units into different divisions on several occasions along with divesting several units. All of this made it difficult to monitor results from year-to-year. Its balance sheet was leveraged up significantly in 2016 and as sales growth stalled, NWL wrote off $8.3 billion of acquired goodwill and other intangible assets. This was followed by several large divestments of operating businesses. It is worth noting that during this time, NWL never missed its adjusted EPS forecasts even though it underperformed on revenue guidance many times. It wasn’t until 2017 that the market finally caught on to the lack of growth and the stock cratered. NWL still trades for less than half its 2017 peak and it has taken a long time for the company to rebuild investor trust.
Note that we do not currently follow NWL and have not done a recent analysis of its results. This article is not intended to be a commentary on the quality of the company’s results reported since the timeframe discussed above.
Contact behindthenumbers@btnresearch.com for questions regarding our institutional service.
Disclosure:
This article is intended for educational purposes and not investment advice.
Behind the Numbers, LLC is an independent research firm structured to provide analytical research to the financial community. Behind the Numbers, LLC is not rendering investment advice based on investment portfolios and is not registered as an investment adviser in any jurisdiction. All research is based on fundamental analysis using publicly available information including SEC filed documents, company presentations, annual reports, earnings call transcripts, as well as those of competitors, customers, and suppliers. Other information sources include mass market and industry news resources. These sources are believed to be reliable, but no representation is made that they are accurate or complete, or that errors, if discovered, will be corrected. Behind the Numbers, LLC does not use company sources beyond what they have publicly written or discussed in presentations or media interviews. Behind the Numbers does not use or subscribe to expert networks. All employees are aware of this policy and adhere to it.
The authors of this report have not audited the financial statements of the companies discussed and do not represent that they are serving as independent public accountants with respect to them. They have not audited the statements and therefore do not express an opinion on them. Other CPAs, unaffiliated with Mr. Middleswart, may or may not have audited the financial statements. The authors also have not conducted a thorough "review" of the financial statements as defined by standards established by the AICPA.
This report is not intended, and shall not constitute, and nothing contained herein shall be construed as, an offer to sell or a solicitation of an offer to buy any securities referred to in this report, or a "BUY" or "SELL" recommendation. Rather, this research is intended to identify issues that investors should be aware of for them to assess their own opinion of positive or negative potential.
Behind the Numbers, LLC, its employees, its affiliated entities, and the accounts managed by them may have a position in, and from time-to-time purchase or sell any of the securities mentioned in this report. Initial positions will not be taken by any of the aforementioned parties until after the report is distributed to clients, unless otherwise disclosed. It is possible that a position could be held by Behind the Numbers, LLC, its employees, its affiliated entities, and the accounts managed by them for stocks that are mentioned in an update, or a Peek Behind the Numbers article.