


Mom and Dad Just Pulled into the Driveway!
Higher rates and the FASB may be about to break up the supply chain finance party

We began writing about the proliferation of supply chain financing programs (SCF) five years ago and warned investors about companies enjoying an unsustainable tailwind to cash flow growth by accelerating their use of these short-term financing vehicles. Low interest rates have allowed these programs to continue to grow and proliferate with little attention paid by most investors. Last week, we discussed in The Goodwill Boomerang how rising rates may result in a wave of unexpected goodwill impairments as higher discount rates erode the estimated fair value of those assets. Similarly, we believe rising rates are about to end the SCF party by shining an unwelcome light on the extent to which many companies have seen their cash flows driven higher by the expansion of their supply chain financing.
In addition, the FASB announced this summer it will be requiring enhanced disclosure regarding these programs under which many companies will have to report considerably more detail than they currently disclose. The new rules go into effect in 2023 and include requirements to disclose not only key terms of the agreements but also quarterly outstanding balances. Also, beginning in 2024, companies must disclose a “roll-forward” amount showing the total of outstanding invoices they have yet to pay. Current disclosures vary widely from company to company with some already reporting much of what the FASB is requiring while others disclose little or nothing.
We will discuss the potential problems with supply chain financing and take a look at three companies that are likely to be impacted by any reduction in their use.
What’s So Wrong With Supply Chain Financing?
In a supply chain financing arrangement (also known as reverse factoring), a company sets up a facility at a bank that allows its suppliers to sell their receivables from the company to the bank. The payable remains outstanding on the company’s balance sheet, but now the company must pay the bank back rather than the supplier. In the past, supporters of reverse factoring have extolled its many virtues for both parties. Buyers get to hold onto their cash longer to use in their business. Likewise, suppliers get cash from their receivables to fund their inventories.
Let’s be clear: there is nothing inherently wrong with SCF programs when used as a way to responsibly maximize working capital efficiency. However, there are three potential problems that analysts should always be on the lookout for and we will examine each below.
Unsustainable cash flow tailwinds
The first way an aggressive SCF program can distort financial results is to give the impression of artificially strong cash flow growth. A company does not have to have an SCF program in place to stretch its payables. It can simply choose to pay invoices later than it did last quarter. While this may result in losing early pay discounts, it will allow it to pay the cash later which will make the current period’s cash outflows look better than the ones before. An SCF allows the company to do this to an even greater degree by giving its most powerful suppliers a chance to collect earlier while the company elects to pay the bank back as late as possible. As a result, we have seen days payable outstanding (DPOs) for many companies rise steadily from the 40 to 50-day range to well above 100 days in the span of a couple of years, increasing the time they take to pay invoices by 50-100%. Such a move will provide a boost to cash flow growth as long as the DPOs continue to grow. However, they can’t grow forever and when the growth in payables extension stops, so will the tailwind to cash flow growth.
Is an SCF masking a company’s true debt load?
The FASB has heard investor concerns regarding the current lack of real disclosure requirements for SCFs with some calling for factored amounts to be disclosed on a separate line item on the balance sheet and the cash flow statement. We don’t believe that these steps are necessary for vigilant investors to obtain the information they need to assess a company’s exposure to an SCF program. However, these concerns stem from a very legitimate recognition of the possibility of a company’s true debt load going underappreciated by investors relying on just headline “long-term debt” and “short-term debt” tags used by data services. DPOs rising from 45 to 110 or yes, over 200, represents a company taking on significant short-term liabilities which will be a use of future cash. Investors must consider this when assessing a company’s leverage.
Higher rates change the game
The stock market, the bond market, and the housing market are all clearly demonstrating to the world how higher interest rates can dramatically alter the present value of a series of cash flows. There has also been much discussion of how higher rates impact the situation of debtors. Likewise, higher rates are likely to unravel the expansion of SCF programs.
Our above outline of the advantages of SCF programs to both buyers and suppliers omitted one detail that has often been left out of the discussion- banks don’t do things for free. However, the historically low interest rates prevailing after the financial crisis have made it feel that way. While details may vary from program to program, it is customary for the supplier to pay the bulk of the interest rate charged by the bank to collect on the amounts owed them before the invoice date. This is not likely to impact the decision for a supplier to allow their receivables to be submitted to the SCF when short-term rates are at “zero point something.” However, with rates climbing toward the mid-single digits, it gets much more expensive to essentially pay for your customer to hold onto your cash longer. Suppliers are likely to cease participating in the programs and push the buyers to pay the invoices earlier or effectively increase prices on invoices paid after a certain date. When this happens, the same mechanism that led to cash flow growth accelerating will lead to a sizeable cash flow headwind. Our look at Procter & Gamble (PG) below discusses this concept in more detail.
Examples of Companies That Will Be Impacted by the SCF Party Ending
We will take a look at a few companies that have utilized SCF arrangements to a material degree and offer a simple framework for assessing the impact on their earnings and cash flows. As a reminder, the lack of FASB guidance on the matter results in drastic differences in what each company discloses about its SCF.
Keurig Dr. Pepper (KDP)
We wrote a separate report this spring discussing the extent to which KDP has extended its accounts payable which readers can review here. However, we can’t help but bring the company’s SCF back up again given it is one of the heaviest users of such programs that we have ever seen.
The following table shows KDP’s accounts payable and days payable for the last eight quarters:
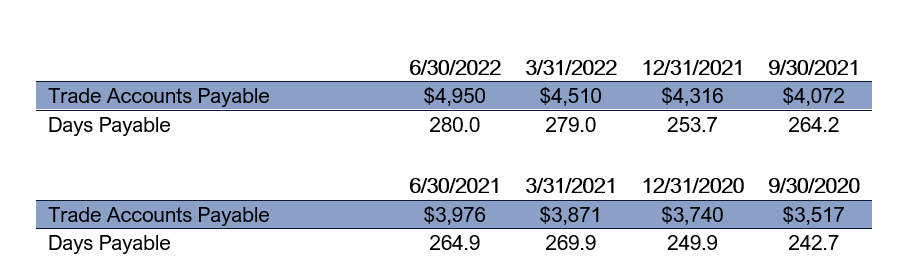
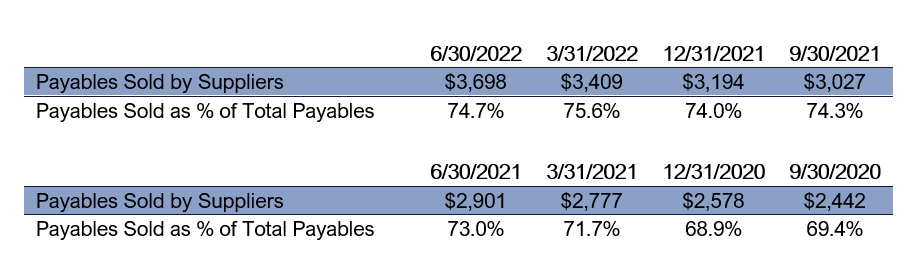
KDP has been stretching its payables for years and as a result, DPOs are now perched at an amazing 280 days. The company discloses the amount of payables sold by suppliers as of the end of the quarter which we show relative to total payables in the table below:
Impact on KDP’s Debt
As noted above, analysts must consider whether or not a company’s stretching of its payables is meaningful to its leverage picture. Many investors only look at a company’s headline long-term and short-term debt numbers to determine how leveraged it is. Traditionally, payables are not considered in leverage ratios as it is normally logical to treat them as a working capital offset to inventories. However, in most cases, when DPOs begin to climb much above the 50-day range, we argue they have effectively become a form of short-term financing that should be included as debt in any leverage ratio.
We can estimate KDP’s “excess payables” by comparing reported payables to what payables would have been at 55 days of sales. If these excess amounts had to be converted to short-term debt, the company would have to pay interest on those balances. In the table below, we show what interest expense would be at 4% as well as what net debt/EBITDA would be if the excess payables were counted as traditional debt. Our results are in the table below:

We see that KDP’s payables would be almost $4 billion less than what it currently carries if DPOs were a more normal 55 days. If this amount was financed at 4%, it would result in an incremental 3 cps in quarterly interest expense which is about 8% of reported EPS. Finally, net debt to EBITDA jumps from 2.8 to 3.8 when these excess payables are counted as debt in the leverage ratio. This is especially important for a company that is touting leverage reduction as part of its growth story.
Impact on KDP’s Cash Flow Growth
Now let’s look at how the increase in accounts payable has impacted the company’s recent cash flow growth. We can’t just look at the increase in payables as payables tend to move with inventory. We could look at the YOY increase in payables sold by suppliers, but the company does not disclose how much it paid to the bank to settle old payables so the true cash flow impact of the program will not be captured.
We will therefore look at the difference in the increase in days payable (DPO) versus the increase in days inventory (DSI). If the only factor leading to an increase in DPOs was an increase in inventory, those two ratios should move relatively in step. However, if DPOs are regularly increasing faster than DSIs, it is a likely indication that the company is delaying payment of its invoices to the benefit of cash flow.
The following table shows the increase in both ratios and the dollar amount of the excess days payable relative to growth in trailing 12-month cash flow:

We see that KDP’s DPO rose by 15.1 days year-over-year in the 6/22 quarter while DSIs rose by 10.3. This 4.8 days of sales in excess payables growth represents $84 million in benefit to cash flow growth in the quarter which is a significant portion of the growth in cash flow over the last twelve months. What’s more, we can see that this is a continuation of a long trend of cash flow benefits, but the size of the benefit is declining. If growth in payables just stops, a key source of cash flow growth will evaporate. However, if growth in payables reverses due to rising rates prompting suppliers to push back, KDP’s cash flow growth could take a huge hit.
The J. M. Smucker Company (SJM)
SJM is an interesting example because it did not start its SCF program until 2020 and it perfectly illustrates the point of how quickly such a program can result in a jump in DPOs:

The company’s disclosure regarding its SCF is relatively robust and offers much of what the FASB will require including the amount the company paid back to the bank to satisfy payables in the program:

Impact on SJM’s Debt
As we did with KDP, we calculate SJM’s excess payables in the table below:

SJM has not stretched payables as far as KDP so the impact on interest expense and debt ratios assuming the company financed the excess payables as short-term debt is not as dramatic. However, let’s look at the impact on cash flow growth:
Impact on SJM’s Cash Flow Growth

We included SJM as an example because it illustrates how a rapid increase in DPOs from an SCF program can result in huge boosts to cash flow growth which can rapidly fade when the expansion of the program stops. We see above that in quarters immediately following the introduction of the program that DPOs were increasing by more than 20 days versus the year-ago periods which was much faster than the increase in inventory DSIs. The resulting boost to cash flow was providing the lion’s share of cash flow growth. The company is now paying the bank back as quickly as it is adding new payables to the program and DPO growth has fallen back in line with inventory growth. As a result, the boost to cash flow growth is now gone.
Procter & Gamble (PG)
We include PG as a final example as it illustrates what happens to cash flow when payables start to contract. The company’s disclosure regarding its SCF is also informative.
The following table shows how PG’s DPOs were increasing year-over-year until the 6/22 quarter when they showed their first decline in some time:

PG offers no quarterly disclosure related to its SCF and very limited disclosure on an annual basis. While its 10-K offers little in the way of numerical detail on the program, it does offer an informative look into SCF programs and even highlights that the benefit to incremental cash flow growth could decline in FY 2023. We include the entire disclosure with our emphasis added:
“Extended Payment Terms and Supply Chain Financing. Beginning in fiscal 2014, in response to evolving market practices, the Company began a program to negotiate extended payment terms with its suppliers. At the same time, the Company initiated a Supply Chain Finance program (the "SCF") with a number of global financial institutions (the "SCF Banks"). Under the SCF, qualifying suppliers may elect to sell their receivables from the Company to a SCF Bank. These participating suppliers negotiate their receivables sales arrangements directly with the respective SCF Bank. While the Company is not party to those agreements, the SCF Banks allow the participating suppliers to utilize the Company’s creditworthiness in establishing credit spreads and associated costs. This generally provides the suppliers with more favorable terms than they would be able to secure on their own. The Company has no economic interest in a supplier’s decision to sell a receivable. Once a qualifying supplier elects to participate in the SCF and reaches an agreement with an SCF Bank, they elect which individual Company invoices they sell to the SCF bank. However, all the Company’s payments to participating suppliers are paid to the SCF Bank on the invoice due date, regardless of whether the individual invoice is sold by the supplier to the SCF Bank. The SCF Bank pays the supplier on the invoice due date for any invoices that were not previously sold to the SCF Bank under the SCF.
The terms of the Company’s payment obligation are not impacted by a supplier’s participation in the SCF. Our payment terms with our suppliers for similar services and materials within individual markets are consistent between suppliers that elect to participate in the SCF and those that do not participate. Accordingly, our average days outstanding are not significantly impacted by the portion of suppliers or related input costs that are included in the SCF. In addition, the SCF is available to both material suppliers, where the underlying costs are largely included in Cost of goods sold, and to service suppliers, where the underlying costs are largely included in SG&A. As of June 30, 2022, approximately 3% of our global suppliers have elected to participate in the SCF. Payments to those suppliers during fiscal year 2022 total approximately $15 billion, which equals approximately 25% of our total Cost of goods sold and SG&A for the year. For participating suppliers, we believe substantially all of their receivables with the Company are sold to the SCF Banks. Accordingly, we would expect that at each balance sheet date, a similar proportion of amounts originally due to suppliers would instead be payable to SCF Banks. All outstanding amounts related to suppliers participating in the SCF are recorded within Accounts payable in our Consolidated Balance Sheets, and the associated payments are included in operating activities within our Consolidated Statements of Cash Flows. As of June 30, 2022 and 2021, the amount due to suppliers participating in the SCF and included in Accounts payable were approximately $6 billion and $5 billion, respectively.
Although difficult to project due to market and other dynamics, we anticipate incremental cash flow benefits from the extended payment terms with suppliers could increase at a slower rate in fiscal 2023. Future changes in our suppliers’ financing policies or economic developments, such as changes in interest rates, general market liquidity or the Company’s creditworthiness relative to participating suppliers, could impact suppliers’ participation in the SCF and/or our ability to negotiate extended payment terms with our suppliers. However, any such impacts are difficult to predict.”
On one hand, PG’s discussion gives a good look at the inner workings of the SCF program. However, visibility into utilization of the program is limited as it only discloses amounts due to suppliers participating in the SCF. Its disclosure will undoubtedly change next year under the new FASB requirements.
However, what stands out to us is the company’s warning that the benefit to cash flow growth may decline in the fiscal year ended 6/23. Let’s look at how the expansion in DPOs versus DSI’s has impacted the company’s cash flow growth for the last few quarters:

Remember, the above analysis considers only the impact of changes in total payables and does not isolate the impact from the change in participation in the SCF. However, we see that the growth in DPOs has fallen below DSI growth in the last two quarters and our estimate of the cash flow benefit from the excess increase in DPOs has turned from a benefit of over $700 million a few quarters ago to a drain of a similar amount. While we don’t know for sure if this was driven by a reduction in participation in the SCF, it certainly seems plausible. If higher rates lead to lower participation over the next year, it could result in a very meaningful headwind to cash flow growth.
Another interesting point in PG’s disclosure is that payment terms are similar for suppliers that participate in the SCF and those that don’t. DPOs indicate that on average, PG takes more than 125 days to pay its invoices whether it pays them to the supplier or the bank. However, remember that a supplier in the program can collect faster if sells its PG receivable to the bank before the due date on the invoice. But look more closely: while only 3% of suppliers are in the program, payments to these suppliers represent 25% of the company’s total costs. In other words, it’s the big guys using the program. The smaller suppliers may not like waiting 125 days to get paid, but there isn’t much they can do about it. However, as rising rates make it more expensive for the big suppliers to utilize the program, they may be large enough to force PG to pay the invoices faster. This perfectly illustrates the pressure that all companies that have been stretching their payables are facing in the current environment.
Contact behindthenumbers@btnresearch.com for questions regarding our institutional research service.
Please share our column with any interested friends and colleagues…
You can follow us on Twitter here
Disclosure:
This article is intended for educational purposes and is not investment advice.
Behind the Numbers, LLC is an independent research firm structured to provide analytical research to the financial community. Behind the Numbers, LLC is not rendering investment advice based on investment portfolios and is not registered as an investment adviser in any jurisdiction. All research is based on fundamental analysis using publicly available information including SEC filed documents, company presentations, annual reports, earnings call transcripts, as well as those of competitors, customers, and suppliers. Other information sources include mass market and industry news resources. These sources are believed to be reliable, but no representation is made that they are accurate or complete, or that errors, if discovered, will be corrected. Behind the Numbers, LLC does not use company sources beyond what they have publicly written or discussed in presentations or media interviews. Behind the Numbers does not use or subscribe to expert networks. All employees are aware of this policy and adhere to it.
The authors of this report have not audited the financial statements of the companies discussed and do not represent that they are serving as independent public accountants with respect to them. They have not audited the statements and therefore do not express an opinion on them. Other CPAs, unaffiliated with Mr. Middleswart, may or may not have audited the financial statements. The authors also have not conducted a thorough "review" of the financial statements as defined by standards established by the AICPA.
This report is not intended, and shall not constitute, and nothing contained herein shall be construed as, an offer to sell or a solicitation of an offer to buy any securities referred to in this report, or a "BUY" or "SELL" recommendation. Rather, this research is intended to identify issues that investors should be aware of for them to assess their own opinion of positive or negative potential.
Behind the Numbers, LLC, its employees, its affiliated entities, and the accounts managed by them may have a position in, and from time-to-time purchase or sell any of the securities mentioned in this report. Initial positions will not be taken by any of the aforementioned parties until after the report is distributed to clients, unless otherwise disclosed. It is possible that a position could be held by Behind the Numbers, LLC, its employees, its affiliated entities, and the accounts managed by them for stocks that are mentioned in an update, or a Peek Behind the Numbers article.