


AFFO- Absurd Funds from Operations
Iron Mountain (IRM) still isn’t covering its dividend in the real world- even with one-time gains

A few months ago, we discussed in The Trouble with Iron Mountain how REITs (real estate investment trusts) are a slightly different animal than common stocks. These special investment structures make capital investments in real estate assets with the expectation of generating large, long-term cash flow streams. The government allows REITs to forego paying taxes on their earnings that relate to real estate ownership as long as they pay out at least 90% of their income to investors as dividends. This results in a relatively high dividend yield and this rich and stable income stream is why the bulk of REIT investors own them.
The REIT structure makes reported GAAP EPS a relatively useless measure for performance. As far as REIT investors are concerned, it’s all about the cash flow. As such, virtually all REITs report a figure called FFO (funds from operations) which is a proxy for sustainable operating cash flow. Most REITs make adjustments to FFO for one-time items and maintenance capital spending to arrive at a figure called AFFO (adjusted funds from operation). This is roughly the equivalent of adjusted free cash flow. Like non-GAAP EPS for common stocks, it serves as the main metric for quarterly performance and most importantly, a gauge of the company’s ability to pay its dividend without the constant need for an influx of outside capital which dilutes existing shareholders.
IRM’s appeal to investors seems to be that it offers the stability of a REIT plus the opportunity to grow with the Cloud through the expansion of its data center operations. However, we believe many investors do not realize that the company’s definition of AFFO features adjustments that, in our opinion, are completely unrealistic and that without these adjustments, AFFO does not cover the company’s dividend. We will examine that as well as multiple one-time benefits that made the 6/22 quarters AFFO figure even less reliable.
IRM’s AFFO Is Still Not Covering the Dividend
We recommend readers review our original IRM piece linked above for a more detailed discussion of adjustments made to FFO and AFFO.
The below table shows IRM’s AFFO for the trailing 12-month periods ended June for the last three years along with our main adjustments to get to a more realistic indication of what IRM has left over to pay its dividend.

We see that for the 2022 period, IRM’s dividend of $723 million is well covered by its headline $1.1 billion in AFFO. However, after our adjustments, AFFO has not been sufficient to cover the dividend for years. We will examine each adjustment below.
Cash for Acquisitions
We start with acquisition spending because this is the adjustment likely to face the most pushback from bulls. They will argue that acquisitions can be discontinued to preserve cash so they should be considered one-time in nature. However, there is a big problem with that logic- IRM isn’t growing much without them. In the latest quarter, storage volume growth was only 50 bps.
The largest part of the storage business is RIM (Records and Information Management). It has 696.6 million cubic feet of RIM in storage. Normally it loses 4%-6% per year as customers take back documents or they have them destroyed as they are no longer needed. Covid was a big help for IRM because few companies were focused much on documents in storage. Yet in 2Q20, IRM had 694.7 million cubic feet in storage. It made acquisitions that came to just under 20 million more cubic feet and it ended 2Q22 essentially flat – it’s up 30bp in two years and has been falling sequentially for over a year.
Investors were cheering the growth in services which is the handling or destruction of documents. However, it’s growing against easy comps as that business was crushed during Covid.

Also, Service growth has been helped by acquisitions. Total service revenue rose 33% in 1Q, but acquisitions were 17% of that. For 2Q, acquisitions were 12.5% of the 33.6% reported growth. The easy comps here end with 3Q22.
IRM cannot have it both ways. It cannot rely on acquisitions to justify a growth multiple of 16 times adjusted EBITDA and then omit the cost of acquisitions as something that isn’t necessary. Internal growth is poor at best, and without acquisition growth, the multiple could easily fall to 13 times or lower which would inflict a 20% drop on the stock price. This drop is magnified because of IRM’s hefty debt load that we calculate at 6.3x EBITDA. (And keep in mind that we believe IRM’s adjusted EBITDA is overstated by some of the same factors impacting AFFO which we discuss below.)
Payments for Business
IRM makes cash payments to acquire new customer relationships, pay for upfront costs to induce new customers to sign, and pay for the movement of records to storage at the beginning of a new contract. These costs are recorded under “acquisition of customer relationships”, “customer inducements”, and “contract fulfillment costs” in the financing section of the cash flow statements. Since these costs do not flow through operating cash flow, they are not included in EBITDA or net income and as a result, they are not counted in FFO or AFFO. However, these are very real ongoing cash costs that the company must spend to stay in business and show organic growth. These costs are shown in the table below for the last twelve quarters:
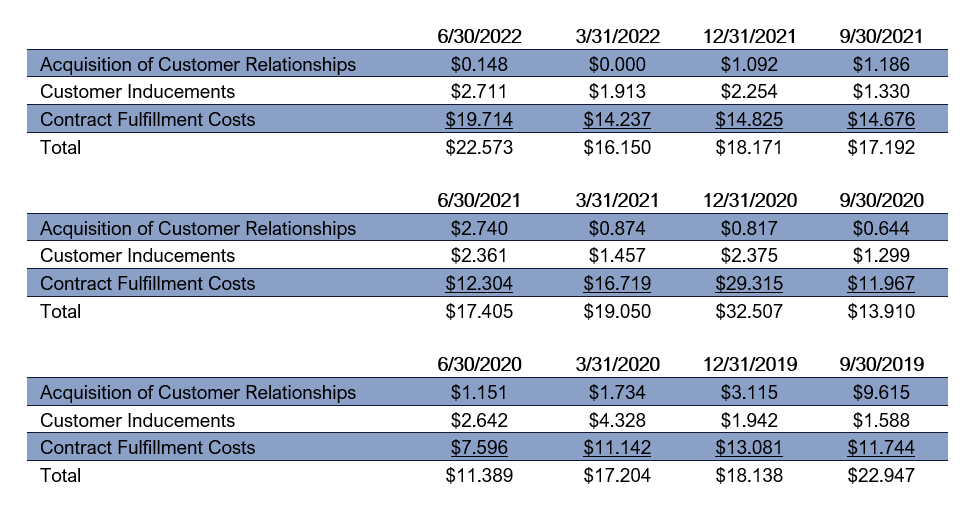
(Note that in table 1 showing BTN-adjusted AFFO, we show the total of these charges under the “payments for business” heading.)
A key thing to note about these costs is that they declined during Covid as customers cut back on transferring records to IRM. However, these costs are now rising again. Adding back these costs amounted to a 7.7 cps benefit to the 6/22 quarter’s AFFO, up from 6.0 cps in the year-ago quarter.
Stock-based compensation
Like many companies, IRM adds back stock compensation to its adjusted results based on the fact that they are considered non-cash. However, the company has to issue new shares to cover the options which dilutes existing shareholders. If it didn’t, it would have to pay its employees in cash as they consider the options a very real part of their compensation and would likely leave if there stopped getting them.
Cash flows used in financing leases
IRM utilizes financing leases for many of its facilities. Under GAAP, the company records the depreciation portion of the lease as an operating cash flow while the larger, financing portion is included under the financing section. Like the payments to business adjustment discussed earlier, these financing lease payments are not removed from EBITDA, FFO or AFFO even though they regularly consume cash. Therefore, we believe any reasonable measure of AFFO should have these payments subtracted to offer an accurate reflection of cash left over to pay dividends.
We can see that after these adjustments, IRM’s AFFO regularly falls short of the cash necessary to cover the dividend. However, the 6/22 quarter contained multiple one-time benefits which likewise overstated the AFFO growth in the period which we will examine below.
Declining Reserve for Bad Debts Added 3 cps to EPS
IRM increased its allowance for doubtful accounts during the pandemic which is understandable. And like many companies we follow, IRM has been taking those reserve levels down over the last few quarters. The following table shows the calculation of allowance for bad debts as a percentage of gross receivables for the last twelve quarters:

We see that despite a year-over-year and sequential increase in receivables, the allowance declined on an absolute basis which drove the allowance percentage down 150 bps. We estimate that this could have added approximately 3 cps to EPS (and AFFO) growth in the quarter.
Acquisition and Integration Costs Were Up
Even though acquisitions are a regular occurrence at IRM, the company adds back all ancillary costs associated with them to its FFO and AFFO calculations. These are largely paid in cash and given their regularity, we would argue that they should be considered part of the company’s strategy and not added back in the calculation of AFFO. We can see in the following table that these amounts jumped considerably in the last two quarters to roughly 6 cps which erodes the quality of reported AFFO.

Maintenance Capex Is Declining
IRM categorizes its capital spending into “growth” and “recurring” categories. We will refer to the recurring category as “maintenance capex” as it represents the capital spending the company considers to be necessary to support its business at current levels. The company subtracts maintenance capex from FFO in its calculation of AFFO. The following table shows the breakdown of capital spending for the last twelve quarters:

The 6/22 quarter enjoyed a $3.5 million year-over-year decline which added 1.2 cps to AFFO growth in the period.
Also, remember from the discussion of acquisitions that IRM’s EBITDA multiple is dependent on growth and continuing to spend on expanding and upgrading its data center properties. Therefore, we could argue that it would be logical to subtract growth capex in the calculation of AFFO as well. However, we will refrain from making that adjustment for this exercise. This also brings up the issue of the subjectivity involved in determining what is “recurring” capex and the resulting potential for manipulation of results that determination brings with it.
Summing It All Up
Just looking at the 6/22 quarter, IRM reported AFFO of 93 cps. However, after adjusting for 7.7 cps in payments for business, 6.9 cps for stock compensation, and 3.3 cps in financing lease payments, we are down to just 74.7 cps in AFFO. Take out the 5.8 cps in acquisition and integration costs, the 3 cps in lower bad debt expense, the 1.2 cps decline in maintenance capex, 1.5 cps in non-cash rent expense, and the 0.6 cps for the company’s estimate of what rent will be raised in the future and we are already down to 63 cps in adjusted AFFO to cover a 62 cps dividend. This does not include any impact from acquisitions.
Hopefully, it is clear why we contend that IRM is not covering its dividend with any reasonable measure of internally generated cash.
Contact behindthenumbers@btnresearch.com for questions regarding our institutional service.
Please share our column with any interested friends and colleagues…
You can follow us on Twitter here
Disclosure:
This article is intended for educational purposes and is not investment advice.
Behind the Numbers, LLC is an independent research firm structured to provide analytical research to the financial community. Behind the Numbers, LLC is not rendering investment advice based on investment portfolios and is not registered as an investment adviser in any jurisdiction. All research is based on fundamental analysis using publicly available information including SEC filed documents, company presentations, annual reports, earnings call transcripts, as well as those of competitors, customers, and suppliers. Other information sources include mass market and industry news resources. These sources are believed to be reliable, but no representation is made that they are accurate or complete, or that errors, if discovered, will be corrected. Behind the Numbers, LLC does not use company sources beyond what they have publicly written or discussed in presentations or media interviews. Behind the Numbers does not use or subscribe to expert networks. All employees are aware of this policy and adhere to it.
The authors of this report have not audited the financial statements of the companies discussed and do not represent that they are serving as independent public accountants with respect to them. They have not audited the statements and therefore do not express an opinion on them. Other CPAs, unaffiliated with Mr. Middleswart, may or may not have audited the financial statements. The authors also have not conducted a thorough "review" of the financial statements as defined by standards established by the AICPA.
This report is not intended, and shall not constitute, and nothing contained herein shall be construed as, an offer to sell or a solicitation of an offer to buy any securities referred to in this report, or a "BUY" or "SELL" recommendation. Rather, this research is intended to identify issues that investors should be aware of for them to assess their own opinion of positive or negative potential.
Behind the Numbers, LLC, its employees, its affiliated entities, and the accounts managed by them may have a position in, and from time-to-time purchase or sell any of the securities mentioned in this report. Initial positions will not be taken by any of the aforementioned parties until after the report is distributed to clients, unless otherwise disclosed. It is possible that a position could be held by Behind the Numbers, LLC, its employees, its affiliated entities, and the accounts managed by them for stocks that are mentioned in an update, or a Peek Behind the Numbers article.
I am a student. What clues might be in an annual report if a REIT was paying its dividend by borrowing money? How do you think about capital structure in general? :) Thank you for the great article.