


Abbott’s (ABT) Q2 Setback- Were There Warning Signs?
Our earnings quality concerns going into the quarter, and what to look for in the upcoming 10-Q

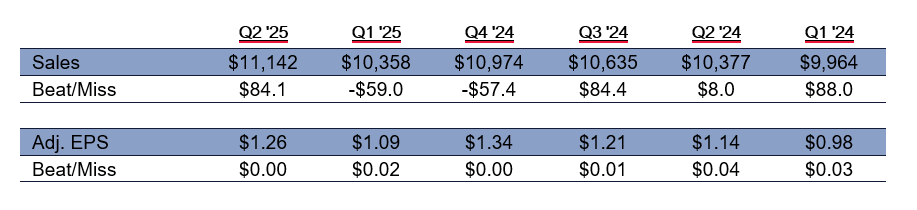
After rallying over the last year, healthcare bellwether Abbot Laboratories (ABT) saw its stock price fall almost 9% yesterday. Its sales came in slightly above expectations while its non-GAAP EPS was essentially in line. However, despite the sales beat, the company lowered its 2025 organic revenue growth forecast to 6.0%-7.0% from its previous range of 7.5%-8.5%. Full-year non-GAAP EPS forecasts were likewise reduced to $5.05 to $5.25 from $5.10 to $5.20. In addition, ABT's Q3 guidance of $1.28-$1.32 was below the Street consensus of $1.33, which was more than enough to drive the unusual decline.
While this is our first mention of ABT on Substack, we warned our institutional clients in April about earnings quality red flags we noticed after Q1. We noted that ABT's revenue had fallen short of expectations in the previous two quarters, and its EPS beats had not been very impressive of late. The company has also recorded several impairments in recent quarters. The bulk of these are charges against indefinite-lived assets that are not amortized. In Q1'25, ABT's $1.09 in adjusted EPS depended on adding back 20 cents in intangible asset amortization, 0.6 cents from impairments of inventory and fixed assets, and 8.4 cents by assigning $23.4 billion of purchases to Goodwill, which is not expensed under GAAP.
ABT has not released its 10-Q yet, and regrettably, it does not include either a balance sheet or a cash flow statement in its earnings press release. However, we will outline our earnings quality concerns below and point out what we will be looking for when the Q is published later this month.
Receivables Rose Considerably in Q1
DOSs jumped by 4 days y/y in Q1'25. We found no discussion of the reason for the increase, but DSOs hit 64.5, and the level has been above normal for several quarters now:

One day of sales is $113.5 million, so the 4-day y/y increase was potentially $450 million in incremental sales, yet ABT still missed forecasts by $59 million.
We believe that much of the operating costs, such as R&D and marketing, are budgeted ahead of time and don't fluctuate significantly based on sales outcomes. Therefore, we look at gross margin to determine EPS impacts.
Every $100 million in incremental sales is worth 2.7 cents in adjusted EPS, and ABT only beat by 2 cents in Q1.
The unusual increase in receivables could have easily generated an extra 5-10 cents of EPS.
A further increase in DSOs from this level in Q2 would cast considerable quality concerns, in our view.
Receivables Allowance Were Higher – but Sales Allowances Were Down

The allowance includes bad debt reserves but also sales allowances for rebates, discounts, and other pricing-related items.
The sales allowances are netted against sales. Normally, if the allowance is rising, it indicates that sales were negatively impacted more than in prior quarters. If the allowance falls, then net sales likely rose.
Also, keep in mind that changes to the sales allowance do not impact costs – so the cost of goods sold should be the same whether allowances are rising or falling.
ABT reports bad debt expense and write-offs every quarter:

We can compare the change from the bad debt portion of the reserve to the change in the total reserve to isolate the change in sales allowances shown below:

The decline in the sales allowance was immaterial in Q1 and Q4 at a $2 million and $3 million decrease, which was a minor boost to sales.
However, this is worth watching because there has been a $10-$16 million boost in reported sales in other recent quarters.
Also, only once in the last eight quarters did the allowance rise, so this may be something set to increase again in upcoming quarters and pressure sales.
Stock Compensation Declined by 26 bps, Adding 1.3 Cents to Adjusted EPS in Q1'25

To ABT's credit, it does not add back stock compensation to adjusted results.
Stock compensation is typically the highest in Q1. However, in Q1'25, it declined y/y in dollar terms and as a percentage of sales.
The net impact was 1.3 cents of EPS – when ABT beat by only 2 cents.
Contact behindthenumbers@btnresearch.com for questions regarding our institutional research service.
Disclosure:
This article is intended for educational purposes and is not investment advice.
Behind the Numbers, LLC is an independent research firm structured to provide analytical research to the financial community. Behind the Numbers, LLC is not rendering investment advice based on investment portfolios and is not registered as an investment adviser in any jurisdiction. All research is based on fundamental analysis using publicly available information including SEC filed documents, company presentations, annual reports, earnings call transcripts, as well as those of competitors, customers, and suppliers. Other information sources include mass market and industry news resources. These sources are believed to be reliable, but no representation is made that they are accurate or complete, or that errors, if discovered, will be corrected. Behind the Numbers, LLC does not use company sources beyond what they have publicly written or discussed in presentations or media interviews. Behind the Numbers does not use or subscribe to expert networks. All employees are aware of this policy and adhere to it.
The authors of this report have not audited the financial statements of the companies discussed and do not represent that they are serving as independent public accountants with respect to them. They have not audited the statements and therefore do not express an opinion on them. Other CPAs, unaffiliated with Mr. Middleswart, may or may not have audited the financial statements. The authors also have not conducted a thorough "review" of the financial statements as defined by standards established by the AICPA.
This report is not intended, and shall not constitute, and nothing contained herein shall be construed as, an offer to sell or a solicitation of an offer to buy any securities referred to in this report, or a "BUY" or "SELL" recommendation. Rather, this research is intended to identify issues that investors should be aware of for them to assess their own opinion of positive or negative potential.
Behind the Numbers, LLC, its employees, its affiliated entities, and the accounts managed by them may have a position in, and from time-to-time purchase or sell any of the securities mentioned in this report. Initial positions will not be taken by any of the aforementioned parties until after the report is distributed to clients, unless otherwise disclosed. It is possible that a position could be held by Behind the Numbers, LLC, its employees, its affiliated entities, and the accounts managed by them for stocks that are mentioned in an update, or a Peek Behind the Numbers article.