


A Look at the Beneish M-Score
Ratios are helpful- but they can't do the work for you

The overwhelming majority of investors do not care about earnings quality when things are going well. When money is easy and markets are going up, no one gives a thought about how real the earnings are. However, when something blows up, say a California bank, earnings quality is suddenly thrust back into the limelight. Therefore, it is no surprise to us that Dr. Messod Beneish’s name was back in the headlines a few weeks ago for a recent paper he and his co-authors recently published entitled Aggregate Financial Misreporting and the Predictability of U.S. Recessions and GDP Growth. This was discussed in a Wall Street Journal article last month. The professors conclude that the aggregate M-Scores of 2,000 companies, a measure of the likelihood that a company is manipulating its financial results, is at its 40-year high and may be signaling an upcoming recession. While published in December, the piece has understandably garnered a great deal of attention in the last few weeks after the Silicon Valley collapse and the faltering markets have increased the concern that we are falling into a recession.
We thought it would be a good opportunity to explain the M-Score, discuss what it can (and cannot) do, and give some quick thoughts about how dependable the recession signal might be.
What Is the M-Score
Messod Beneish is a professor of accounting at the University of Indiana. In 1999, he authored a paper entitled The Detection of Earnings Manipulation in which he proposed a score based on ratios calculated from company balance sheets and income statements that could predict the likelihood that a company was manipulating its financial results. While the paper received attention at the time, it was not thoroughly appreciated until it was revealed after the Enron scandal that college students had used the model to predict problems at Enron three years before the company blew up.
The so-called “M-Score” has eight components, each with a different weighting, which results in an aggregate score. We will discuss each component in more detail below, but here are the names of each component as presented in the original paper:
DSRI (Days Sales in Receivables Index)
GMI (Gross Margin Index)
AQI (Asset Quality Index)
SGI (Sales Growth Index)
DEPI (Depreciation Index)
SGAI (Sales General and Administrative Expenses Index)
LVGI (Leverage Index)
TATA (Total Accruals to Total Assets)
The above ratios are calculated and then run through the following formula:
M-Score = -4.84 + 0.92 * DSRI + 0.528 * GMI + 0.404 * AQI + 0.892 * SGI + 0.115 * DEPI – 0.172 * SGAI + 4.679 * TATA – 0.327 * LVGI
The higher the company’s M-Score, the greater the likelihood that it is manipulating its earnings. Any reading higher than -1.78 was deemed to indicate the company has a high likelihood of being a manipulator based on the parameters used by Dr. Beniesh in an updated study from 2013.
Some Thoughts on the M-Score
We are big fans of Dr. Beneish’s work and appreciate his pioneering contributions to financial analysis. The M-Score may very well have a place in investors’ toolkits. But we strongly caution investors that a single number can never take the place of carefully scrubbing the financial statements, footnotes, company presentations, and conference calls when it comes to assessing the reliability of reported earnings and the degree to which management may or may not be managing the numbers. With that in mind, we wanted to offer a few warnings to investors using quantitative scores alone to assess the earnings quality risks of the companies they own.
There is a difference between fraud and earnings management
We can’t emphasize this point enough. High-profile scandals like Enron, WorldCom, and the 2008 crisis spawned a fascination with finding the next fraud. Earnings quality analysis is viewed as something used by activist short sellers to peel back the layers of the Adani empire rather than a skill all analysts should sharpen and use as a regular component of their investment process.
From that standpoint, it is important to note that the effectiveness of the M-Score in the original paper was tested on companies that had to restate their earnings as a result of inappropriate accounting. While the researchers did conduct extensive searches in the media for mentions of earnings restatements, references to companies that were suspected by analysts of utilizing aggressive accounting techniques were ignored. That is understandable since such research needs a hard pass/fail metric to go on and earnings restatements provide that. Regardless, the M-Score from the beginning was designed to “swing for the fences.”
However, while revelations of fraud may kill a stock price overnight, it is no secret that companies engage in earnings management to appease Wall Street and keep stock prices high to meet bonus targets. A 2019 survey of CFOs revealed that 90% believed at least some companies manage their earnings to meet Wall Street expectations. We like to refer to this as “stretching the rubber band.” If a company knows it will come up short of expectations in this quarter it may decide to extend more generous credit terms, dip into a reserve, get a little more aggressive on capitalization, or delay some marketing spending to doll up its quarterly EPS with hopes of catching up next quarter. If the growth doesn’t come back, it may pull a few more levers to make the next quarter. This may go on for a while, but eventually, the rubber band snaps and the company disappoints leading to a meaningful stock price decline.
Four of the eight components of the M-Score are not intended to measure evidence of manipulation
Dr. Beneish’s original paper clearly pointed out that several of the metrics were designed to measure “either the effects of manipulations or preconditions that may prompt firms to engage in such activity.” In other words, some of the metrics are not indicating manipulation is happening, but rather just that a motive exists. For example, a declining gross margin is not evidence a company manipulated earnings, it merely indicates the firm is experiencing declining profitability and may be tempted to prop up earnings by cutting expenses elsewhere to keep its bottom line growing. In fact, Dr. Beneish noted in his original paper that some earnings manipulations will actually manifest themselves as an increase in gross margin.
Another example of this is the leverage index which measures the increase of a company’s debt relative to its assets compared to the previous year. The logic is that a company with rising debt may be more inclined to manipulate its earnings to remain in compliance with debt covenants. While this may be an increased risk factor, not all companies with rising debt manage their earnings.
The preconditions ratios result in underscoring other manipulations
As we noted above, not all companies with rising debts or declining gross margins manipulate. But perhaps more importantly, not all companies that manage their earnings see their debt increase or their gross margins decline during the year. Let’s say a company has not increased its debt over the last year but it is has managed to meet earnings expectations for the last three quarters in a row by cutting bad debt reserves in one quarter, under-reserving for warranties in the second, and increasing the capitalization of contract costs in the third. While it has stretched the rubber band, its M-Score may not be near the red zone because its gross margin has been flat and its debt has not jumped. This highlights our point that the only way to be comfortable with a company’s earnings quality is to do the hard work of analyzing several quarters of financial data, sifting through footnote disclosures, and reading conference call transcripts to see if management’s story and the numbers line up.
In the next section, we will take a quick look at each component of the M-Score and discuss how recent, unique macro factors may be impacting the usefulness of the M-Score.
A closer look at each measure and recent impacts
The global pandemic, supply chain disruptions, the Russian invasion of Ukraine, and rampant inflation have had enormous impacts on companies’ financial statements and ratios based on them over the last three years. This has made it much more difficult for analysts looking for meaning in trends in traditional financial ratios. The M-Score is no exception. Below, we will examine each component of the score and discuss recent trends we have seen in these ratios that should be considered when evaluating the current level of market aggregate M-Score. We break the components out between those that measure the effects of manipulation and those that measure the preconditions for manipulation.
Effects of manipulation
DSRI (Days Sales in Receivables Index)
The DSRI is a classic measure of the growth in receivables relative to sales. For the purpose of the M-Score, it is calculated as:
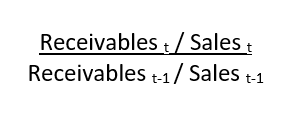
An increase in receivables relative to sales can be an indication that sales came through late in the quarter as a result of companies becoming more aggressive in offering better payment terms. This pulls revenue into the current quarter at the expense of the next. However, a jump in receivables can also be signaling an acquisition or a benign acceleration of sales in the period which results in revenues being booked but there simply isn’t enough time to collect the bill before the end of the quarter.
The pandemic has definitely impacted how analysts should read year-over-year changes in receivables ratios. At the outset of the pandemic, many companies saw their revenues plummet while receivables collections slowed, leading to increases in days sales ratios (DSOs). However, as revenues stayed muted and old receivables were collected, DSOs quickly fell. As conditions recovered and sales accelerated, DSOs again rose. This has very likely skewed the market aggregate and made any recent signals from rising DSOs less informative.
AQI (Asset Quality Index)
The asset quality index measures the change in the proportion of non-current assets other than property, plant, and equipment to total assets:
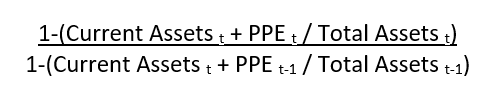
If this measure is declining it can be an indication that a company has begun to increase the capitalization of an expense into a long-term asset account, thus artificially benefitting earnings. In our experience, the pandemic has not meaningfully impacted the trend in this ratio.
DEPI (Depreciation Index)
The depreciation index measures the change in depreciation as a percentage of property, plant, and equipment:
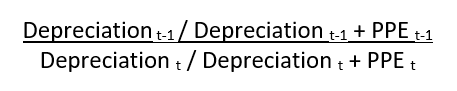
A decline in this ratio indicates a company is becoming more aggressive in its depreciation accounting policies which is artificially benefitted earnings. Many companies have delayed their capital spending during the pandemic which has led to declines in both depreciation expense and PPE which has distorted the trend in this ratio and likely reduced its usefulness at the aggregate level.
TATA (Total Accruals to Total Assets)
In the original Beneish paper, total accruals to total assets was calculated as follows:

In subsequent literature, total accruals were calculated as net income minus cash flow from operations minus cash flow from investments divided by total assets. Both are effectively measuring the difference between cash received and income. Accruals represent profits that have yet to be received in cash. Increases in asset accounts other than cash or declines in non-financial liability accounts indicate that either revenue has been booked without receiving cash, or cash has been spent without booking an expense. A high ratio means a greater portion of earnings is based on accounting assumptions rather than the cash that came in the door.
We will explore earnings accruals more closely in future installments, but one weakness in the ratio as calculated is it does not take into consideration that companies may have high accrual rates because of their business models or because they are in a growth phase. It is therefore recommended that accrual analysis examine periodic changes in accruals and a comparison of accruals to other companies in the industry.
Concerning macro conditions in the last three years, we have seen considerable distortions in the ratio. Receivables are a component of accruals and therefore the factors impacting receivables discussed above have also impacted accrual ratios. Supply chain disruptions and inflation have caused both shortages and later spikes in inventory balances, a key component of accruals. Other factors such as increases in bad debt reserves at the beginning of the pandemic to historically high levels have been followed by a period of companies reeling them in which have impacted seasonal trends in accruals. All of these factors could have been artificially inflating the accruals ratio of the market aggregate.
Preconditions that may prompt
GMI (Gross Margin Index)

We discussed above how the M-Score considers a decline in gross margin to signal an increased likelihood of earnings manipulation as companies with declining profitability may be tempted to pull out the accounting tricks to compensate. As we noted, Dr. Beneish admitted that in some cases, an increase in gross margin may be a sign of manifestation of manipulation itself but it is included in the M-Score because a statistically significant number of proven manipulators had rising gross margins.
In the last three years, gross margins have most definitely been distorted from historical trends. Few are the companies that have not reported significant gross margin declines in the wake of supply chain hangups in addition to materials, shipping, and wage inflation. This would have artificially amplified the negative signal of the GMI in the M-Score in recent years. Likewise, as margins begin to recover, it will artificially reduce the signal.
SGI (Sales Growth Index)
The sales growth index simply measures the growth in revenue between periods:

High sales growth is considered a negative indicator in the M-Score as Dr. Beneish found that higher-growth companies were more likely to manipulate their earnings. This is a clear example of a ratio that indicates a possible propensity to manipulate rather than evidence of manipulation itself. In fact, many companies we consider to be serial manipulators are in slow-growth industries trying to find ways to push earnings growth just a little higher.
The pandemic has played havoc with historical sales trends. 2020 saw some companies report plummeting sales growth while others such as Clorox (bleach) and Kimberly Clark (the infamous run on toilet paper) saw their sales skyrocket. As conditions normalized, these trends reversed. Now sales growth for most companies is slowing down to a more normal level.
SGAI (Sales General and Administrative Expenses Index)
The SGA index measures the change in the SG&A expense as a percentage of sales:
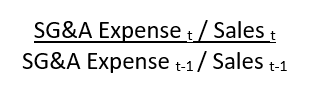
The M-Score considers an increase in the SG&A expense percentage as a negative indicator of earnings quality. The logic is that rising SG&A could be considered a negative by analysts so a company might be inclined to boost its earnings growth through manipulation. However, like gross margin, it could be argued that a declining SG&A percentage came about through manipulation. For example, cutting accrued warranties could result in lower SG&A expense while other non-accrual forms of earnings manipulation such as cuts to marketing expense would do the same.
The SG&A percentage for most companies has been elevated throughout the pandemic as companies battle with rising labor costs and other inefficiencies which could have artificially magnified the negative signal to the M-Score. We expect this will drop off as costs and volumes normalize over the next few quarters.
LVGI (Leverage Index)
The leverage index measures the change in total debt as a percentage of assets:
The M-Score considers rising leverage to be a negative indicator of earnings quality as companies with more debt may be inclined to stretch earnings measures to stay in compliance with covenant ratios. While this is very logical, it is another example of a motivation to manipulate rather than evidence. It is well advised to pay close attention to the results of highly leveraged companies, but a company with no debt can still be an egregious earnings manipulator.
After a long period of paying 6%-9% interest, getting 12 years of 0%-2% rates may have skewed the impact of this ratio. Lower interest rates made higher investment spending much cheaper to buy. As rates now rise, increasing leverage may have a more negative impact going forward. For example, in the late 1980s and the Leveraged Buy-Out craze, companies were looking to cut short-term costs to retire debt as they were paying 10%-14%. It was almost a universal mathematical truth that if the acquisition resulted in more than 7x EBITDA in debt – any macro hiccup made it almost impossible to service debt as scheduled. That wasn’t necessarily earnings manipulation, it was simply an excess interest expense figure. Buying something for 12x EBITDA with a combination of 4% interest debt and $100/per share equity that may inherently be worth only $20 is much is much more affordable than 6x EBITDA at 14%.
Conclusion
Dr. Beniesh has always been clear that a high M-Score does not prove a company is a manipulator and that investors should take it as a sign that a company simply fits the statistical profile of other companies that have later proven to be manipulators. However, many investors use formulas such as the M-Score or other quick, quantitative measures as a litmus test to determine if a company’s reported earnings are high quality or not. We caution that the use of such canned ratios alone is a dangerously incomplete way to protect against earnings quality risk. As we showed above, many factors can cause ratios to flash both false positives and false negatives. The only proper way to assess earnings quality is through a detailed examination of several periods of financial statements and footnotes which takes into consideration the outside factors driving them. This involves painstaking work that many investors simply are not willing to put in.
As far as whether the historically high aggregate market M-Score is signaling an imminent recession, we would take that with a grain of salt. We agree with the notion that high points in fraud lead to downturns. Given recent crypto fiascos and the rise of SPACs, we can’t argue with Jim Chanos labeling the recent past a “golden age of fraud.” However, given how much the first global pandemic in 100 years, the largest European land war in 70 years, and the worst inflation in 40 years have impacted most of the components of the M-Score, we are not sure how much can be based on the current market aggregate score.
If you are interested in hearing about our institutional research service, please contact behindthenumbers@btnresearch.com.
You can follow us on Twitter here
Disclosure:
This article is intended for educational purposes and is not investment advice.
Behind the Numbers, LLC is an independent research firm structured to provide analytical research to the financial community. Behind the Numbers, LLC is not rendering investment advice based on investment portfolios and is not registered as an investment adviser in any jurisdiction. All research is based on fundamental analysis using publicly available information including SEC filed documents, company presentations, annual reports, earnings call transcripts, as well as those of competitors, customers, and suppliers. Other information sources include mass market and industry news resources. These sources are believed to be reliable, but no representation is made that they are accurate or complete, or that errors, if discovered, will be corrected. Behind the Numbers, LLC does not use company sources beyond what they have publicly written or discussed in presentations or media interviews. Behind the Numbers does not use or subscribe to expert networks. All employees are aware of this policy and adhere to it.
The authors of this report have not audited the financial statements of the companies discussed and do not represent that they are serving as independent public accountants with respect to them. They have not audited the statements and therefore do not express an opinion on them. Other CPAs, unaffiliated with Mr. Middleswart, may or may not have audited the financial statements. The authors also have not conducted a thorough "review" of the financial statements as defined by standards established by the AICPA.
This report is not intended, and shall not constitute, and nothing contained herein shall be construed as, an offer to sell or a solicitation of an offer to buy any securities referred to in this report, or a "BUY" or "SELL" recommendation. Rather, this research is intended to identify issues that investors should be aware of for them to assess their own opinion of positive or negative potential.
Behind the Numbers, LLC, its employees, its affiliated entities, and the accounts managed by them may have a position in, and from time-to-time purchase or sell any of the securities mentioned in this report. Initial positions will not be taken by any of the aforementioned parties until after the report is distributed to clients, unless otherwise disclosed. It is possible that a position could be held by Behind the Numbers, LLC, its employees, its affiliated entities, and the accounts managed by them for stocks that are mentioned in an update, or a Peek Behind the Numbers article.