

Behind Coherent Corp’s Numbers (COHR)
Behind Coherent Corp’s Numbers (COHR)
The red flags are flying

This week we will perform an earnings quality review of Coherent Corp (COHR). We explained last week that our new earnings quality review reports focus on a specific company and rate how exposed it is to the risk of reporting disappointing results or guidance as a result of recent results being distorted by unrealistic, accounting-related benefits. Note that the rating does not take into consideration factors such as competition, industry conditions, valuation, expectations, and recent price movements. There are plenty of sources out there examining those factors- but few that take a critical look at the accounting that produces the numbers the market uses to assess the company’s growth rates, returns, and valuations. Nor do many point out which in the industry are the most conservative or most aggressive.
The analysis will examine the company’s financial results considering multiple factors. We will assign a rating of Pass, Caution, or Alert to each factor as well as an overall rating. The factors are as follows:
Earnings Management Indications
GAAP accounting results depend heavily on estimates made by management and the company’s auditors. Aggressive assumptions and changes to estimates can lead to unrealistic results. Also, an examination of trends in accrual accounts can uncover early warning signs of slowing growth that have yet to show up in the top and bottom lines. We examine recent results and explore unusual movements in key accounts including:
revenue recognition-related accounts such as receivables, contract assets, and deferred revenue
expense accruals such as bad debt reserves, warranty accruals, and capitalized costs
workings capital movements including inventory and payables
Misleading non-GAAP Adjustments
Earnings Management Indications are concerned with GAAP accounting-related matters that impact results. However, practically all companies apply at least some non-GAAP adjustments when presenting their results with some adjustments almost universally applied in some industries. For example, virtually all tech companies add back stock compensation to non-GAAP earnings. Therefore, our rating system compares the percentage or earnings weighting of the add-back to peers in the industry in addition to considering recent company-specific trends that may impact how realistic the adjustment is.
Insufficient Depreciation/Capex
While depreciation expense is often viewed as an earnings management component, we include it in a separate section given its complicated interrelationship with property, plant, and equipment balances and capital spending trends. Factors considered include the company’s depreciation method, its choice of estimated useful lives, capital spending levels, and its average age of equipment versus its peers in the industry.
Cash Flow Quality
We examine factors impacting cash flow growth such as dependence on factoring programs or stretching payables. We also highlight how much of a company’s cash flow is dependent on considering stock compensation and non-cash items.
R&D Understated by Acquisitions
Many companies acquire vital intellectual property via acquisition, but goodwill is not amortized under GAAP and many add back the amortization of intangible assets which erases the impact of the acquisition on non-GAAP results. We assess how much each company is benefitting from acquisition accounting relative to its peers.
How to Read the Earnings Quality Watch Rating
After considering all the factors, a final Earnings Quality Watch rating is assigned as follows:
Pass- No meaningful concern with the reliability of the company’s recent results.
Caution- We noted signs that we believe indicate that recent results have been impacted by earnings quality distortions, but we see only a moderate risk that the company will report an earnings disappointment related to the distortion in the next 2 quarters.
Alert- We noted signs that we believe indicate that recent results have received a material benefit from earnings quality distortions and there are meaningful risk that the company will report an earnings disappointment related to the distortion in the next 2 quarters.
Suggestions for readers managing long portfolios
For all companies of interest with an Earnings Quality Watch rating of Caution or Alert, investors should make sure they have taken all negatively rated factors into account in their risk assessment process.
Note that since factors such as competition, industry conditions, valuation, expectations, and recent price movements are not considered, companies with a Pass rating should not be considered an automatic buy recommendation.
Suggestions for readers managing short portfolios
It is our experience that companies exhibiting signs of earnings management have a higher risk of posting a disappointment. Therefore, we believe all companies with an Earnings Quality Watch rating of Alert are a potentially fruitful place to start looking for potential short ideas. However, we recommend that investors seeking active short ideas take additional considerations into account such as competition, industry conditions, valuation, expectations, and recent price movements before taking a position.
Now, let’s get behind COHR’s numbers…

Summary
Coherent Corp (COHR) has a mixed track record on earnings performance. It often beats adjusted EPS estimates by only 2-4 cents and frequently misses or just hits revenue forecasts. The company claims a huge past growth rate – pointing to a 10-year CAGR of 25%. It is forecasting for a 5-year 14% CAGR through 2028.
We have serious doubts about those past growth rates because COHR simply acquired much of its growth. We see several years with single-digit growth adjusting for purchases. This is also a company where investors likely should spend more time looking at the balance sheet and cash flow statement as the company loses money and is trading for 44x dressed-up non-GAAP earnings.
Points of Concern:
The 25% CAGR includes multiple acquisitions. When we look at organic growth, COHR may only be a mid-single-digit growth company and is posting negative growth in fiscal 2024. COHR is talking about customers working down inventory too.
Revenue growth last quarter was helped by receivables rising and deferred revenue falling. This generated the revenue and EPS beat. That may be a headwind for this quarter.
COHR adds back stock compensation to its non-GAAP earnings. Stock comp fell y/y resulting in an EPS headwind. Cutting cash R&D spending has been a sizeable source of EPS in recent quarters.
Acquisitions have weakened COHR’s balance sheet with billions in debt, preferred stock, and intangibles. We take little comfort in its use of adjusted EBITDA to claim debt is manageable. Capital spending regularly exceeds depreciation, meaning depreciation should be viewed as a cash expense that should not be removed in calculating cash flow or free cash flow. Plus, the preferred stock is senior to the common and the dividend is cutting common EPS. COHR touts an effective debt-to-EBITDA figure of 3.5, but we believe a reasonable case can be made that it is closer to 6x.
COHR also has some large ongoing cash needs for interest expense, capital spending, taxes, and debt payments meaning that netting available cash with debt also does not make sense either.
There could be an impairment for goodwill coming. The laser unit has $3.2 billion of goodwill and exceeded the carrying value last year by only 10%. The estimated fair value of goodwill incorporated estimates for higher sales and margins at the unit which have only declined since then. Also, the 10-year bond is up, so the discount rate may need to rise too.
What Is COHR’s Real Growth Rate?
COHR touts its 10-year CAGR of 25% in its investor presentations. The problem is much of the large growth rates in some periods relate solely to acquisitions:
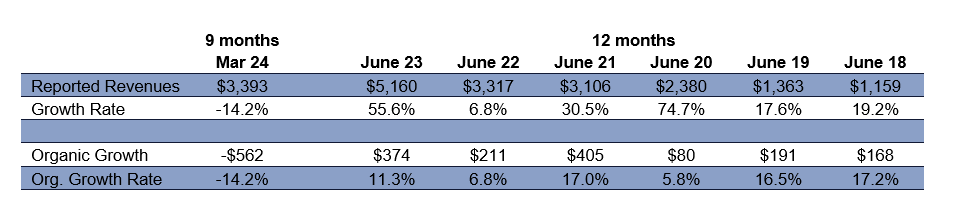
The fiscal year ended June 2023 included a full year of Coherent’s largest deal. We believe the company also boosted prices because the company gave a pro forma table showing that had the deal been in place for both fiscal 2022 and 2023 – revenue growth would have been only 7%.
The Finisar acquisition closed after fiscal 2020 began and only $938 million of Finisar’s annual sales of just over $1.2 billion were added to COHR’s 2020’s reported sales. That is non-organic growth. The business was acquired and creates an apples-to-oranges comparison for reported y/y sales growth. That same situation spiked sales in early 2021 as the remaining $300 million of Finisar’s annual revenue were added to revenue and compared to early 2020 without Finisar. Notice that 2020’s reported growth rate of 74.7% which had a HUGE impact on calculating the 25% CAGR – drops to only 5.8% without the purchased sales of Finisar.
Also in fiscal 2021, COHR bought the remaining 6.1% of INNOViON. Until December 31, 2020, this 93.9% stake was accounted for as an equity investment meaning its sales were not included in COHR’s top line. Fiscal 2021 gained another $21 million from recognizing the revenues of this deal for 6 months. This would have also been a one-time boost to 2022 revenue growth from revenue generated by INNOViON in the first six months of 2022 that were not included in the same period of 2021. However, the company showed that headline sales growth and organic growth were the same in 2022. We estimate that adjusting out INNOViON’s first six months of revenue for 2022 would have resulted in organic revenue growth of 6.1% versus the company’s figure of 6.8%
Clearly, fiscal 2024 has so far been very ugly. If we look at the last five quarters, COHR has not had much growth at all:
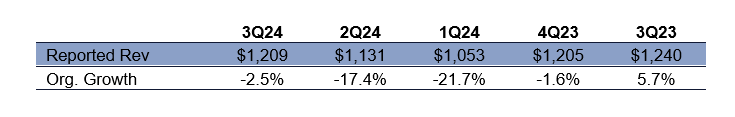
o 1Q24: Sales fell with lower consumer electronic demand, fewer telecom applications, and reduced semiconductor demand.
o 2Q24: Revenues declined in all four COHR markets.
o 3Q24: Revenue fell due to customers working down inventory in telecom and instrumentation, loss of power in auto production, lower macroeconomic demand, and design changes from a large customer.
1Q24 and 3Q24 were the first times we saw COHR point to customers working down inventories. Inventory at COHR has been flat for several quarters – so we did not see an issue there.
Guidance for 4Q24 is for revenue of only $1.23-$1.32 billion – slightly higher y/y. We believe that without acquisitions – COHR has demonstrated to be a mid-single-digit growth story. That’s a far cry from 25%.
Earnings Management Indicators

Revenue recognition
The following table shows accounts receivable and contract liabilities relative to sales for the last eight quarters:
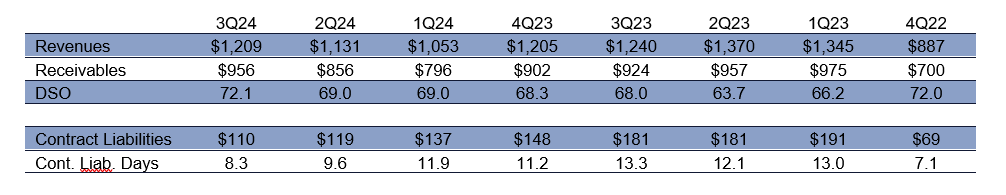
Notice that receivables jumped last quarter by $100 million sequentially and $32 million y/y. That is a tailwind for revenues which beat forecasts by $41.5 million even though they still fell y/y.
DSOs were up 3 days sequentially and 4 days y/y. One day of DSO is worth $13.25 million
If we assume that the incremental gross profit drops the pretax income line, then every day of DSO is worth 2.6 cents in EPS. COHR beat by 11 cents. The DSO growth added 7.8-10.4 cents last quarter.
Also, notice that COHR’s string of disappointing sales came despite also receiving a boost from a decline in contract liabilities which represent cash that has been received from customers but has not met the requirements for recognition as revenue. Contract liabilities dropped from $181 million to $110 million during this stretch. The $9 million sequential drop in 3Q24 was another 1.8 cents of EPS.
We believe the entire sales and EPS beat can be attributed to the above impact of receivables and contract liabilities. If COHR sees DSOs drop in 4Q or contract revenues rise, it could be tough to hit 4Q24 guidance.
Stock compensation decreased as a percentage of sales

We would expect stock compensation to rise as a percentage of sales again and become a minor tailwind to EPS.
Cash R&D may need to increase again too and become a modest headwind. Note that it helped considerably in 2Q24 and 1Q24 when COHR reported EPS beats of 11 cents and 4 cents.
Misleading Non-GAAP Adjustments

The following table shows the significant and recurring non-GAAP adjustments the company makes to its non-GAAP profits:
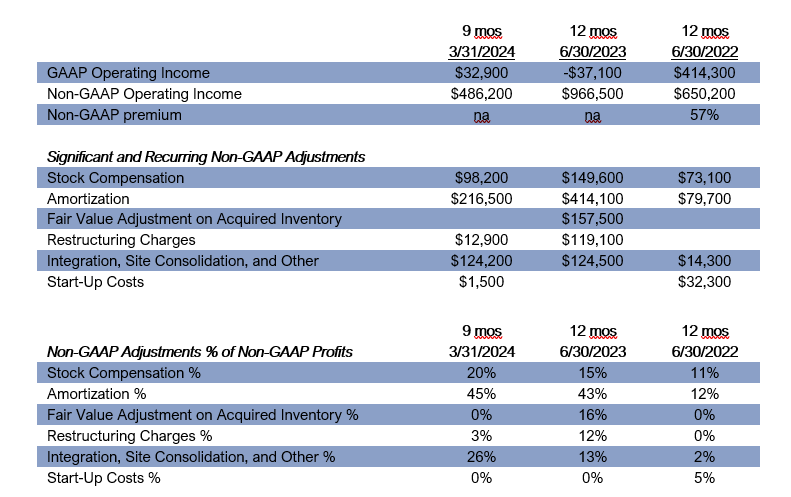
Points to note:
Like virtually all tech companies, COHR adds back stock compensation. We believe this is a distortion given the company would have to pay cash to employees if it didn’t pay them in stock, plus it will have to spend cash to buy back shares to avoid dilution. The adjustment accounts for about 20% of the company’s non-GAAP profits which is on the high end of the industry.
Also like most tech companies, COHR adds the amortization of intangibles back to non-GAAP results. Given the number of large deals the company has made in recent years, ignoring amortization accounts for almost half of non-GAAP results. We discuss in the “R&D Understated by Acquisitions” section why this practice is an especially large distortion when examining COHR’s true profitability.
Insufficient Depreciation/Capex

The following table shows the breakout of the company’s PPE, depreciation, average age, and capex relative to sales:

Below is a breakout of the company’s assets by property type and the estimated useful lives the company uses to calculate depreciation:
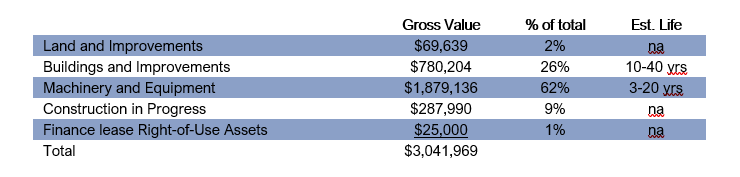
The company’s asset base is quite young. Machinery and equipment make up the bulk of assets. The range of depreciable lives is quite wide (3-20 yrs) but depreciation expense implies that the average effective useful life is in the 7-year range which is not overly aggressive.
Nevertheless, the company is growing rapidly and capex has been above depreciation the last two years and is likely to stay this way for the foreseeable future. As we discuss more below, this makes measures such as EBITDA which consider depreciation a non-cash expense less useful when assessing how well the company can service its sizable debt.
Cash Flow Quality

See the discussion in the next section on the company’s acquisitions, debt levels, and cash flow.
R&D Understated by Acquisitions

Look at What Acquisitions Have Done to the Balance Sheet
After numerous deals, COHR is sitting on $4.5 billion in Goodwill and $3.6 billion in acquired intangible assets. To pay for the deals, COHR owes $4.2 billion in debt, issued $2.4 billion in preferred stock, and the common share count is 152.5 million as of May 3, 2024. The share count has more than doubled from 65.8 million in June of 2019.
All of this looks stretched to us. COHR points to Gross debt/Adjusted EBITDA of 4.4x and Net Debt/ Adjusted EBITDA of 3.5x. Let’s examine each of these parts:
Adjusted EBITDA overstates the cash flow situation here.
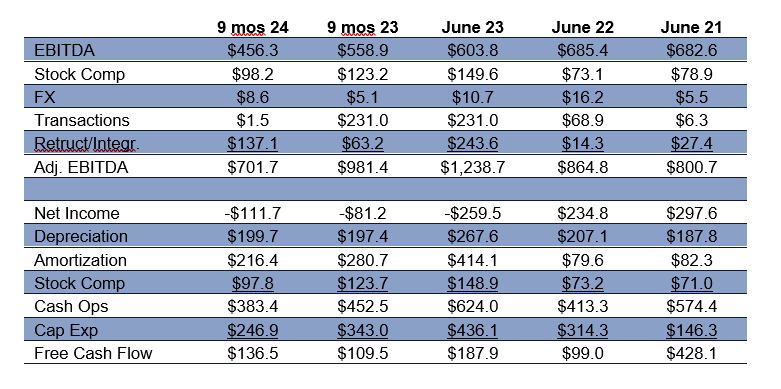
The company loses too much in earnings and often spends more in capital investment than deprecation. Here is a comparison of Adjusted EBITDA vs. Free Cash Flow. Consider that BOTH add back depreciation, amortization of acquired intangibles, and stock compensation:

Adjusted EBITDA has already come down significantly. Guidance should be $1.0 billion down from $1.24 billion y/y for fiscal 2024.
Depreciation is not a non-cash expense. Capital spending has exceeded it in every recent period. Adjusted EBITDA ignores this reality. This company also points to accelerating growth. We doubt that means capital spending will decline.
COHR grows with acquisition and constantly has restructuring and transaction costs – Adjusted EBITDA adds all this back. Free cash flow only adds back the non-cash costs in these areas.
Interest expense is the only cash cost that lowers free cash flow and is fully added back to adjusted EBITDA. However, adjusted EBITDA ignores changes in working capital which have helped free cash flow in all these periods except June 2022.
COHR also sees acquisitions as a part of the operating model and a way to boost growth. Where is the free cash flow to pay for that? Why else would COHR be issuing so much equity and debt to cover its growth plans?
We think at a minimum, Adjusted EBITDA should be marked down by $100-$200 million for the net difference between depreciation and capital spending. That alone raises the debt-to-EBITDA ratio to 5.0-5.6x.
We also would resist viewing debt net of cash. This company has some substantial cash needs: Interest expense consumes $300 million per year, capital spending vs. depreciation consumes $100-$200 million per year, cash taxes are close to $100 million per year, debt payments are light until 2028 but are still $75-$90 million per year now, and the company has talked about repurchasing some shares. COHR has $900 million in available cash.
Investors should not forget the preferred stock
This is on top of common equity with $2.4 billion in fact value. GAAP earnings and non-GAAP earnings both are reduced by the 5% dividend even though it is paid in-kind at this time and is running at $31.2 million per quarter (21 cents per common share in quarterly EPS.
This preferred stock gets dealt with before common and it should be added to the debt when viewing the capital structure. Instead of $4.5 billion in debt, it’s really $6.9 billion in securities over the common stock – that’s 6.9x adjusted EBITDA or 8.6x if we reduce adjusted EBITDA by $200 million for the net capital spending discussed above.
The preferred stock can convert to cash dividends after March 2025. Payments may continue in kind, cash, or a combination. That could add more to COHR’s cash needs in less than a year. The preferred stock converts to common at prices above $85 per share. It represents 19%-20% dilution depending on the amount of dividends paid in-kind before the conversion. The prior issue of preferred stock converted into 10.24 million shares in July 2023.
Could Goodwill and Intangible Assets Face an Impairment?
All of these assets have to have their values justified by the current and future forecasts for revenue, income, and cash flow. We will use the Laser assets as an example. In the 10-K, COHR noted that $3.2 billion of Goodwill is sitting here and on April 1, 2023, its estimate of fair value only exceeded this goodwill by 10%.
COHR’s forecasts for lasers included higher sales volumes and higher margins. It discounted those forecasted results at 13%. Let’s look at the results of the Laser unit since the last impairment test on the first day of 4Q23:
Revenue has declined y/y in each period since the test.
There are no profits and the non-GAAP income (a proxy for cash flow) has declined y/y too with the margin also falling.
We can see the largest adjustments from GAAP to non-GAAP are COHR adding back amortization of intangibles and stock compensation. So the forecast relies on ignoring the part of the purchase price actually being expensed. That clearly consumed cash – that’s why COHR borrowed money and issued preferred stock.
Does this look like the results match the forecast? It shouldn’t take much in lower forecasts to erase the 10% cushion here. The 10-year bond is up about 100bp since April 2023 – a higher discount rate would cut the cushion too.
Contact behindthenumbers@btnresearch.com for questions regarding our institutional research service.
Disclosure:
This article is intended for educational purposes and is not investment advice.
Behind the Numbers, LLC is an independent research firm structured to provide analytical research to the financial community. Behind the Numbers, LLC is not rendering investment advice based on investment portfolios and is not registered as an investment adviser in any jurisdiction. All research is based on fundamental analysis using publicly available information including SEC filed documents, company presentations, annual reports, earnings call transcripts, as well as those of competitors, customers, and suppliers. Other information sources include mass market and industry news resources. These sources are believed to be reliable, but no representation is made that they are accurate or complete, or that errors, if discovered, will be corrected. Behind the Numbers, LLC does not use company sources beyond what they have publicly written or discussed in presentations or media interviews. Behind the Numbers does not use or subscribe to expert networks. All employees are aware of this policy and adhere to it.
The authors of this report have not audited the financial statements of the companies discussed and do not represent that they are serving as independent public accountants with respect to them. They have not audited the statements and therefore do not express an opinion on them. Other CPAs, unaffiliated with Mr. Middleswart, may or may not have audited the financial statements. The authors also have not conducted a thorough "review" of the financial statements as defined by standards established by the AICPA.
This report is not intended, and shall not constitute, and nothing contained herein shall be construed as, an offer to sell or a solicitation of an offer to buy any securities referred to in this report, or a "BUY" or "SELL" recommendation. Rather, this research is intended to identify issues that investors should be aware of for them to assess their own opinion of positive or negative potential.
Behind the Numbers, LLC, its employees, its affiliated entities, and the accounts managed by them may have a position in, and from time-to-time purchase or sell any of the securities mentioned in this report. Initial positions will not be taken by any of the aforementioned parties until after the report is distributed to clients, unless otherwise disclosed. It is possible that a position could be held by Behind the Numbers, LLC, its employees, its affiliated entities, and the accounts managed by them for stocks that are mentioned in an update, or a Peek Behind the Numbers article.